Web Vitals & Metrics
Metric deep-dives that separate Core Web Vitals from adjacent timings, and show why load changes the reading.
Core Web Vitals at load, explained is the reason this category exists: the three Google metrics are usually measured on an idle site, and they move once real traffic arrives. Why lab scores differ from real users explains the gap between a Lighthouse run and the field data in Search Console.
The metric explainers go one at a time. LCP and INP are written for engineers, and each metric has a step-by-step fix guide: improve LCP, improve INP, improve CLS.
The rest are about reading results honestly. p95 and p99 shows why an average hides the users who left, Apdex turns response times into a satisfaction score a stakeholder can follow, and 8 metrics every performance test report should include is the checklist for the report itself.
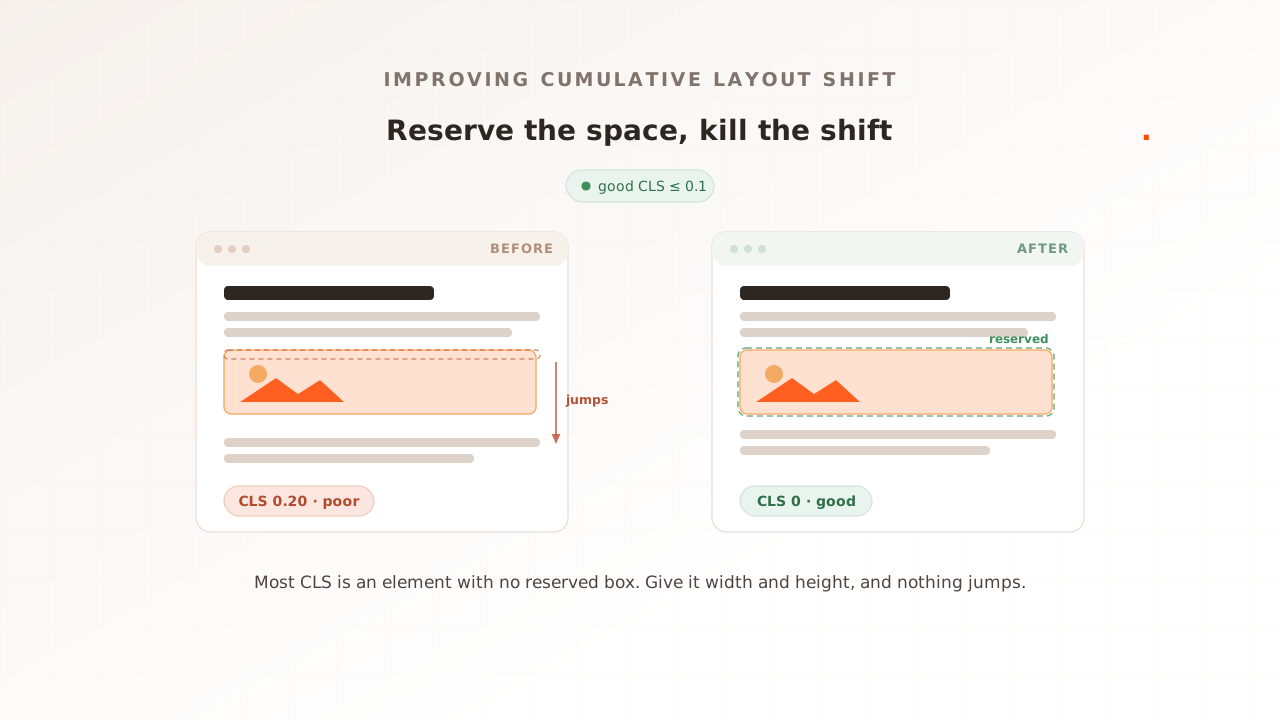
How to improve CLS: a step-by-step optimization guide
Almost every layout shift is the same bug: an element that loads without a reserved box, so everything below it jumps. Cumulative Layout Shift is the easiest Core Web Vital to fix, because the cure is nearly always to reserve the space in advance. This guide is the practical playbook: the fixes in priority order, the code for each, the font trick most teams skip, and how to confirm the number held for real users.
Ahmad Farzan ·
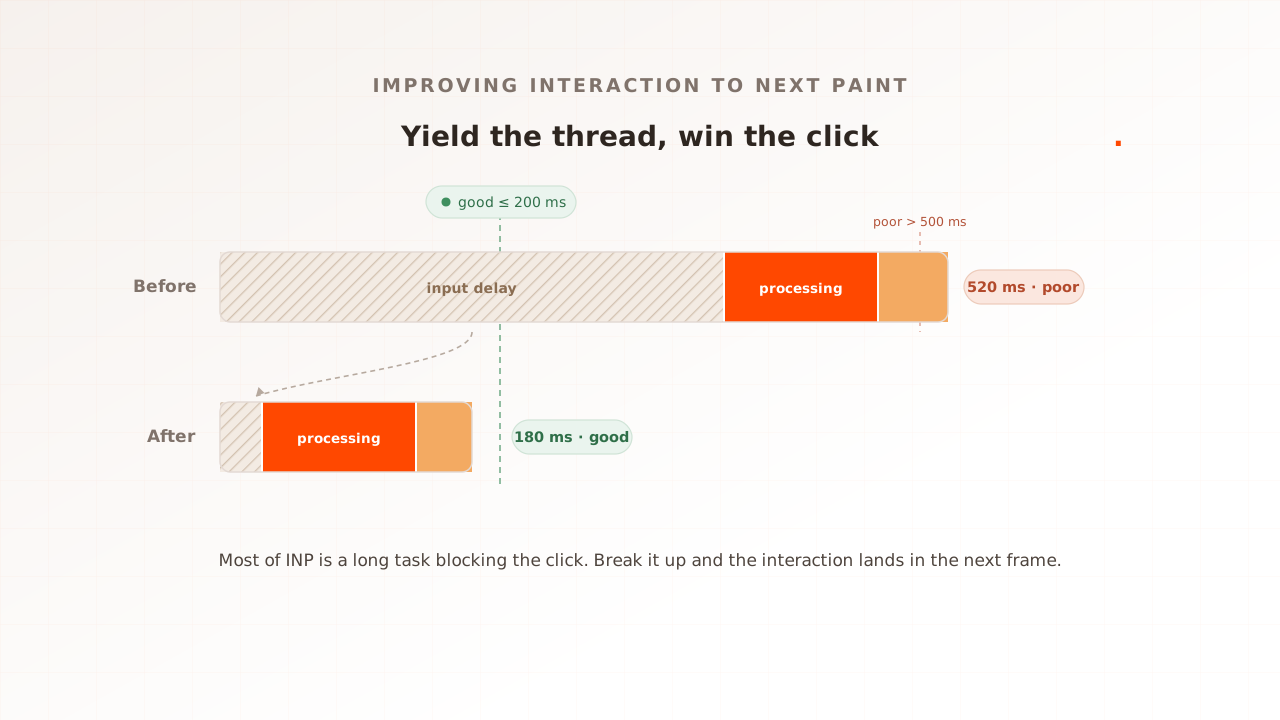
How to improve INP: a step-by-step optimization guide
Most teams trying to improve INP optimize the click handler, and most of the time the handler is not the problem. A long task was already running on the main thread when the user clicked, so the interaction had to wait. This guide is the practical playbook: the fixes in priority order, the code for each, the modern API most sites have not adopted yet, and how to confirm the number actually moved for real users under load.
Ahmad Farzan ·
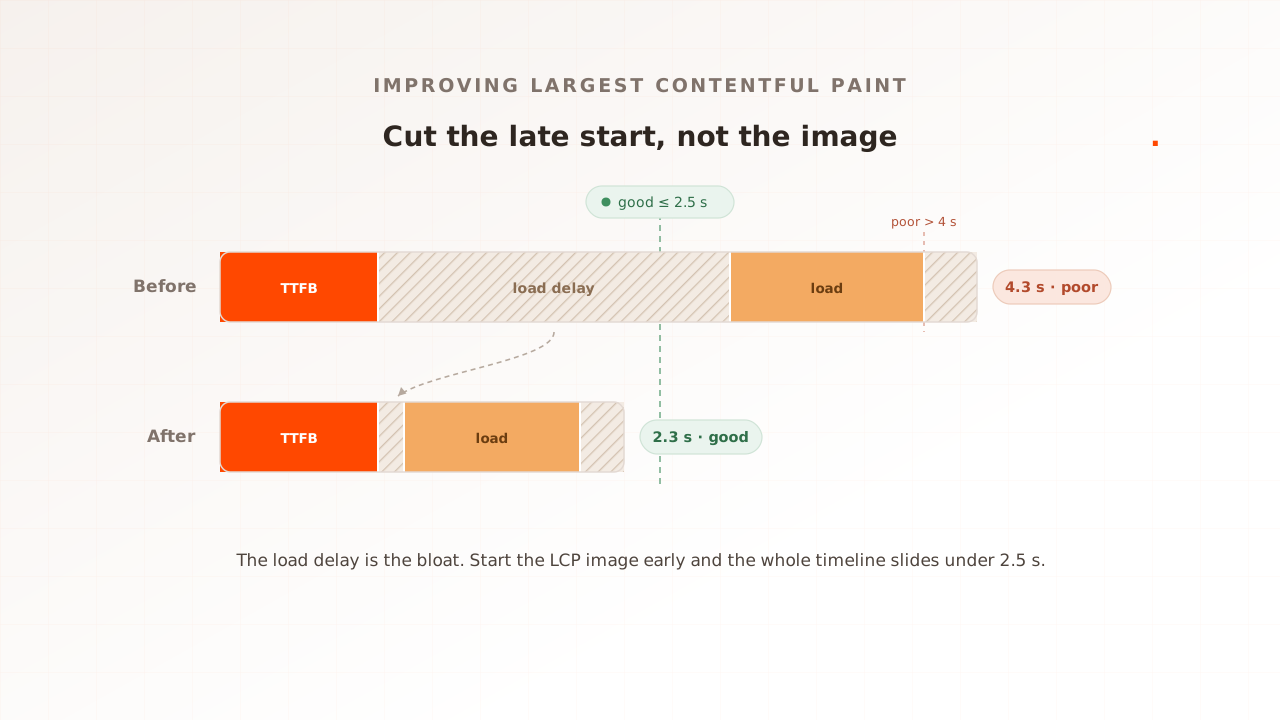
How to improve LCP: a step-by-step optimization guide
Most teams trying to improve Largest Contentful Paint reach for a smaller image, and most of the time the image is not the problem. The browser is starting it too late. This guide is the practical playbook: the fixes in priority order, the code for each, the two 2025 techniques most sites have not adopted, and how to confirm the number actually moved for real users under load.
Ahmad Farzan ·
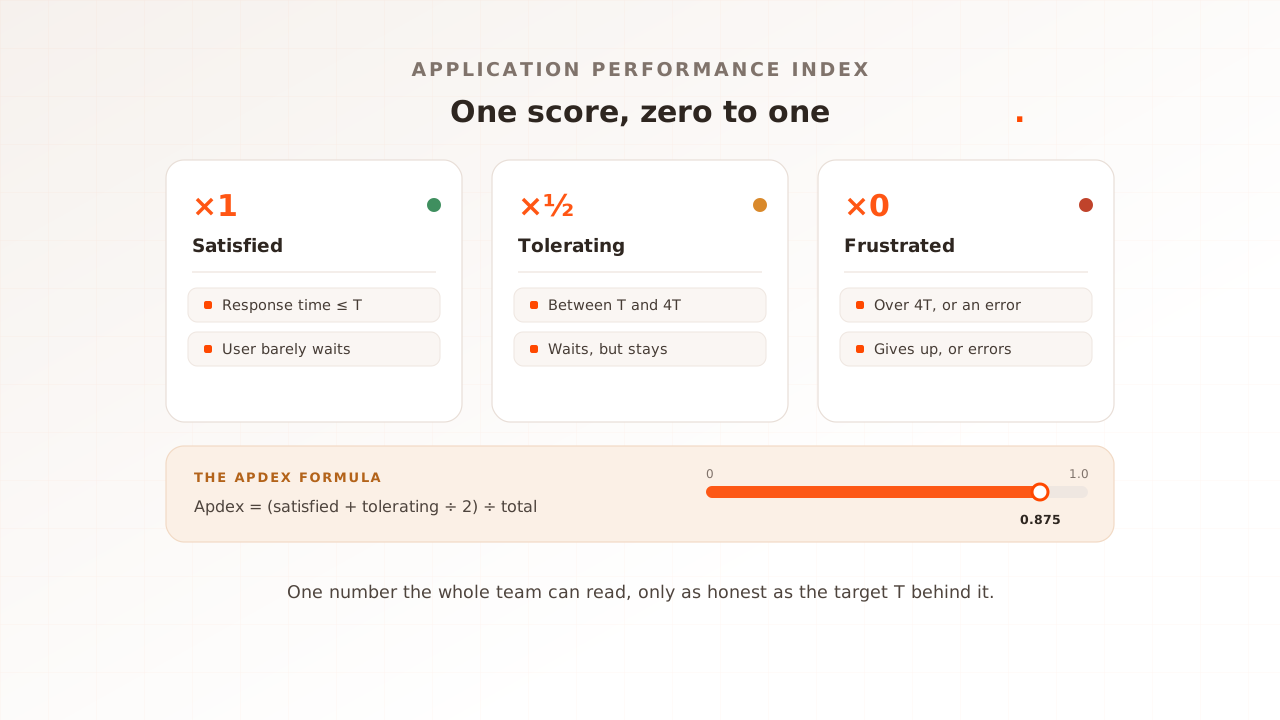
What is an Apdex score? Measuring user satisfaction in performance testing
A load test can come back full of green percentiles and still not tell you whether the people behind them were satisfied or quietly giving up. An Apdex score answers that in one number from 0 to 1: you set a target response time, and it reports how many requests left users satisfied rather than merely tolerating, or frustrated.
Ahmad Farzan ·
Core Web Vitals at load, explained
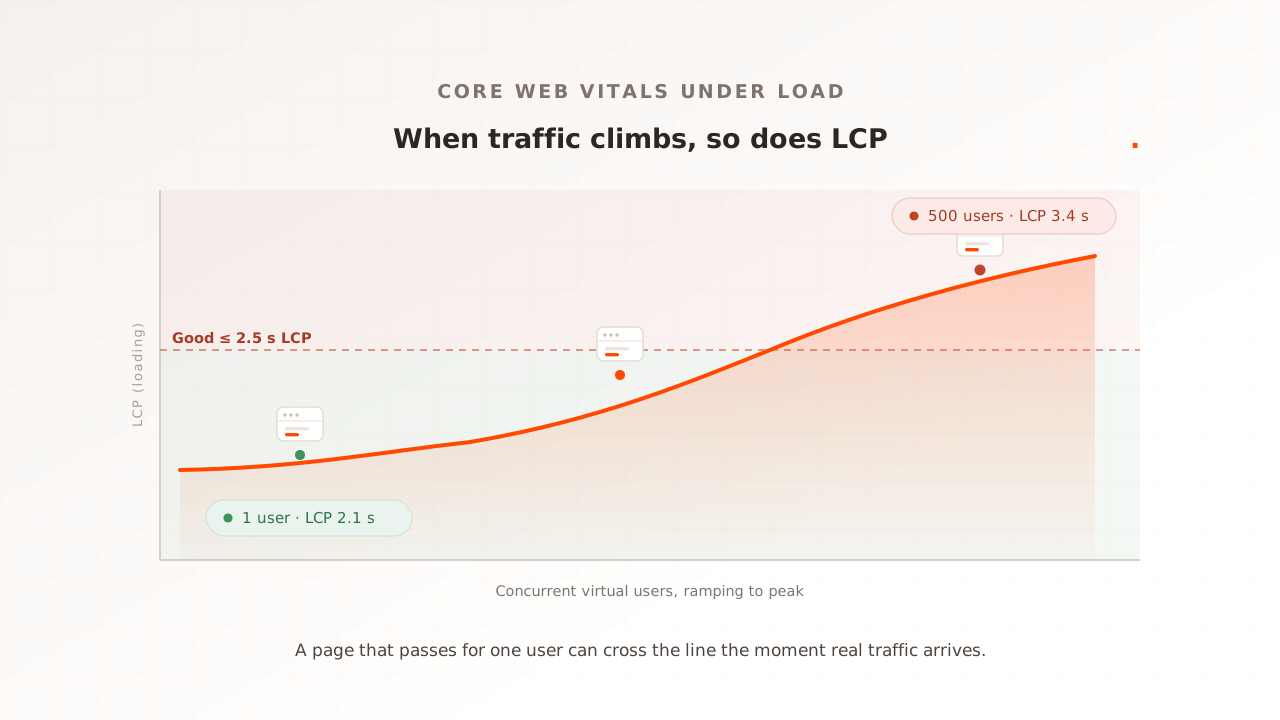
A page can score green in a single-user Lighthouse run and still ship a red Largest Contentful Paint the moment real traffic arrives. Core Web Vitals change under load: the server slows, time to first byte grows, and interactions wait on a busy backend. This guide explains why each Vital moves under load, and how to measure them at concurrency.
Ahmad Farzan ·
Interaction to Next Paint (INP), explained for engineers
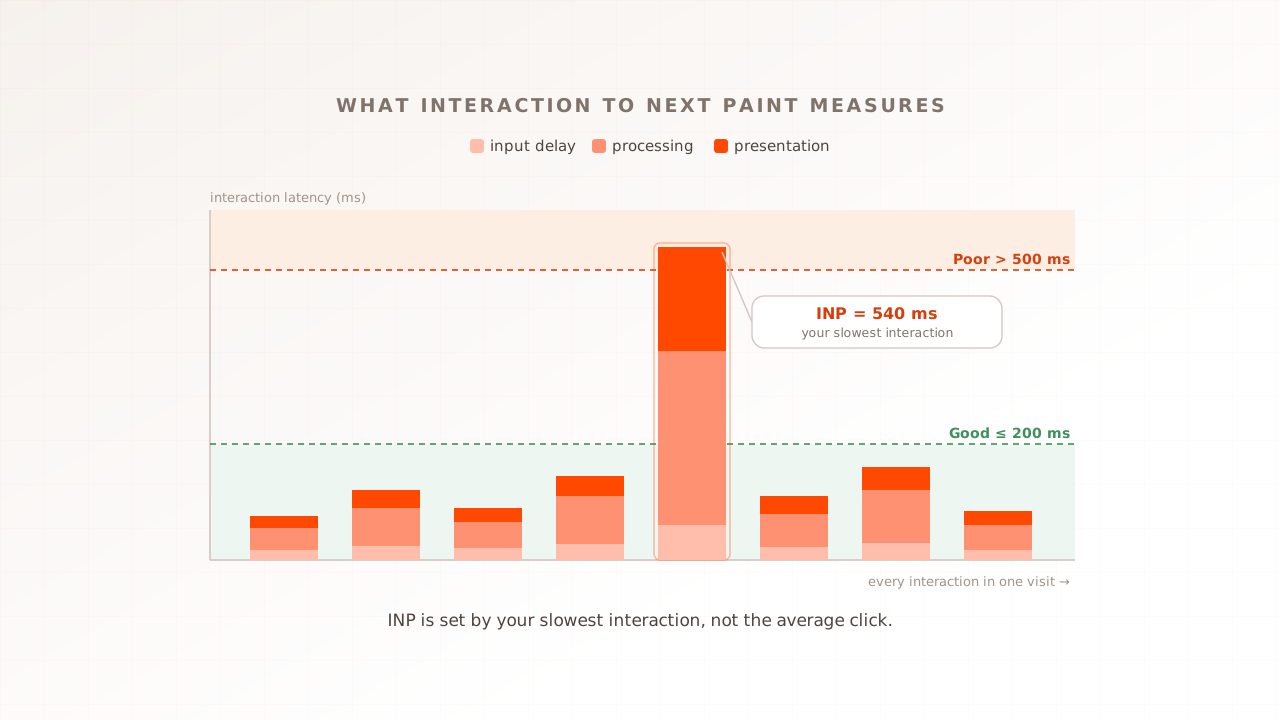
A page can pass every functional test and still feel slow on the second tap. Interaction to Next Paint is the Core Web Vital that catches it: the latency of your slowest interaction across a visit, timed from the click to the next frame painted. Here is what INP captures, what drags it past 200ms, and how to test it under load.
Ahmad Farzan ·
Core Web Vitals: why lab scores differ from real users
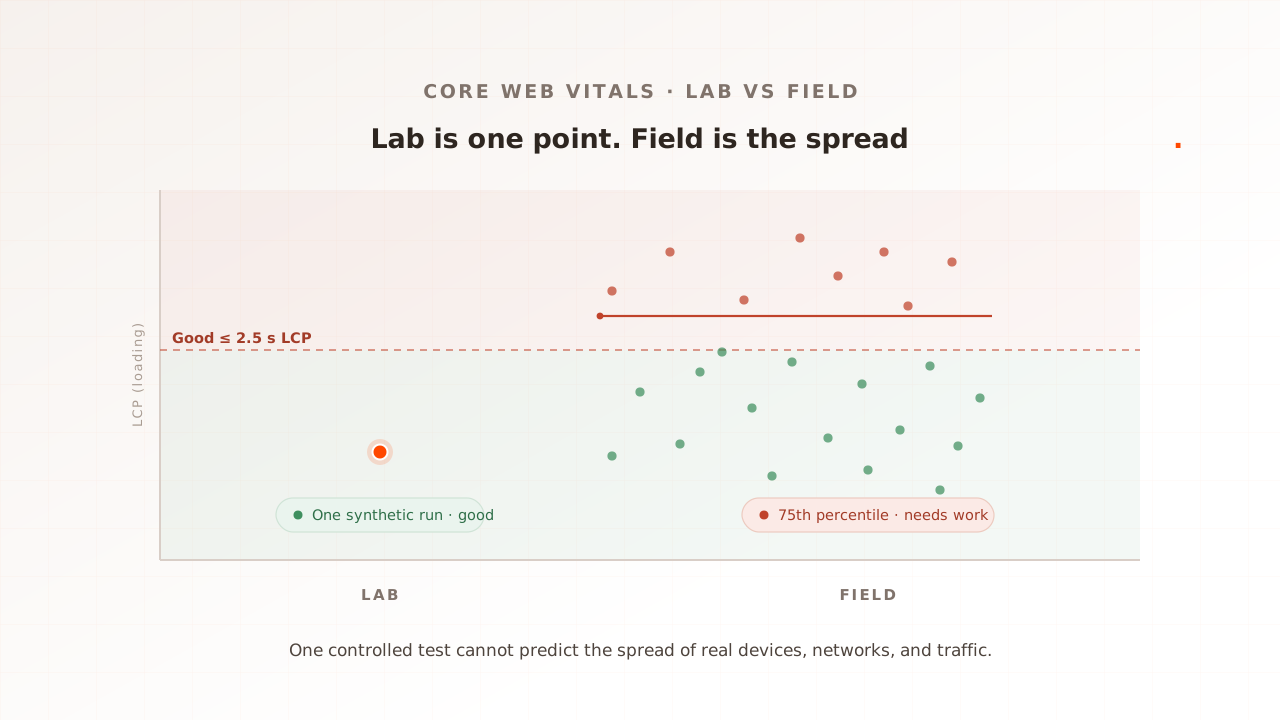
Your Lighthouse score says 98. Your Core Web Vitals report says the page is failing. Both can be right. A lab test measures one synthetic load on a fixed device and network; field data is the spread of every real device, connection, and click your users bring, including the traffic a lab never simulates. Here is why lab and field diverge, and which to trust.
Ahmad Farzan ·
Why average response time misleads you: reading p95 and p99
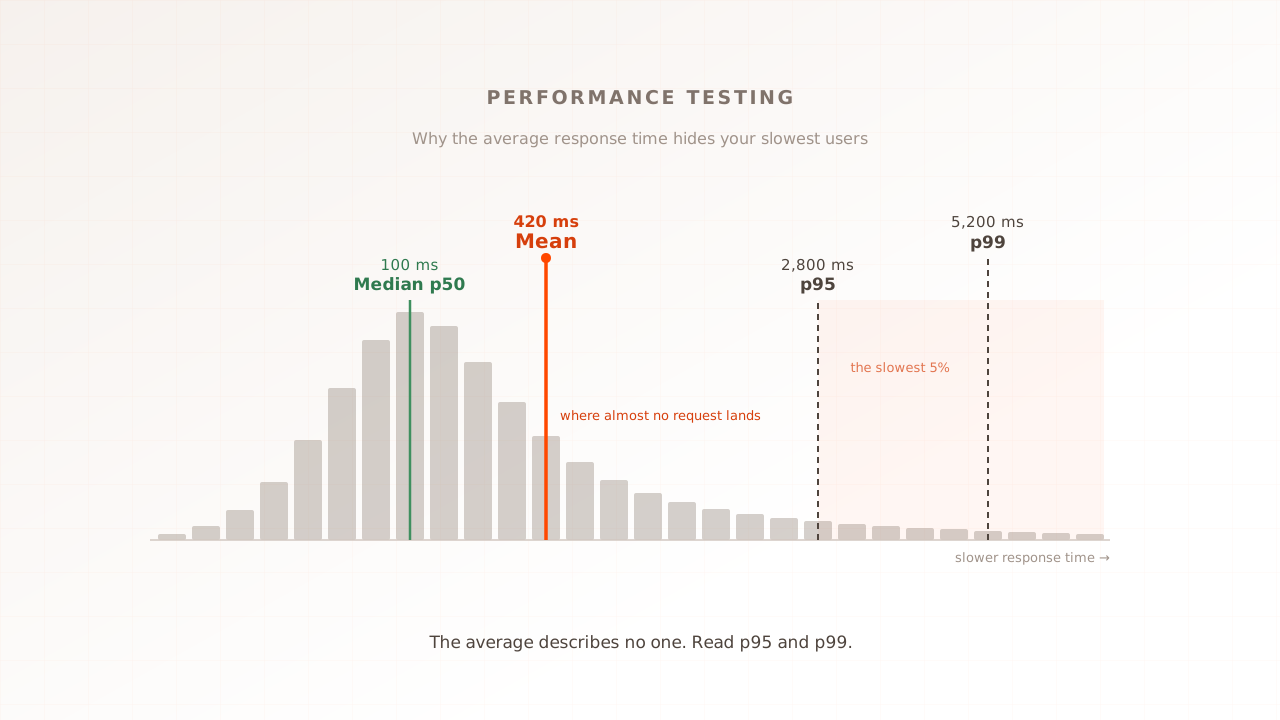
Your dashboard says average response time is 420 milliseconds. Half your users see 100, one in a hundred waits over five seconds, and the average describes none of them. p95 and p99 read response time from the slow end, where the failures you run a performance test to find actually live.
Ahmad Farzan ·
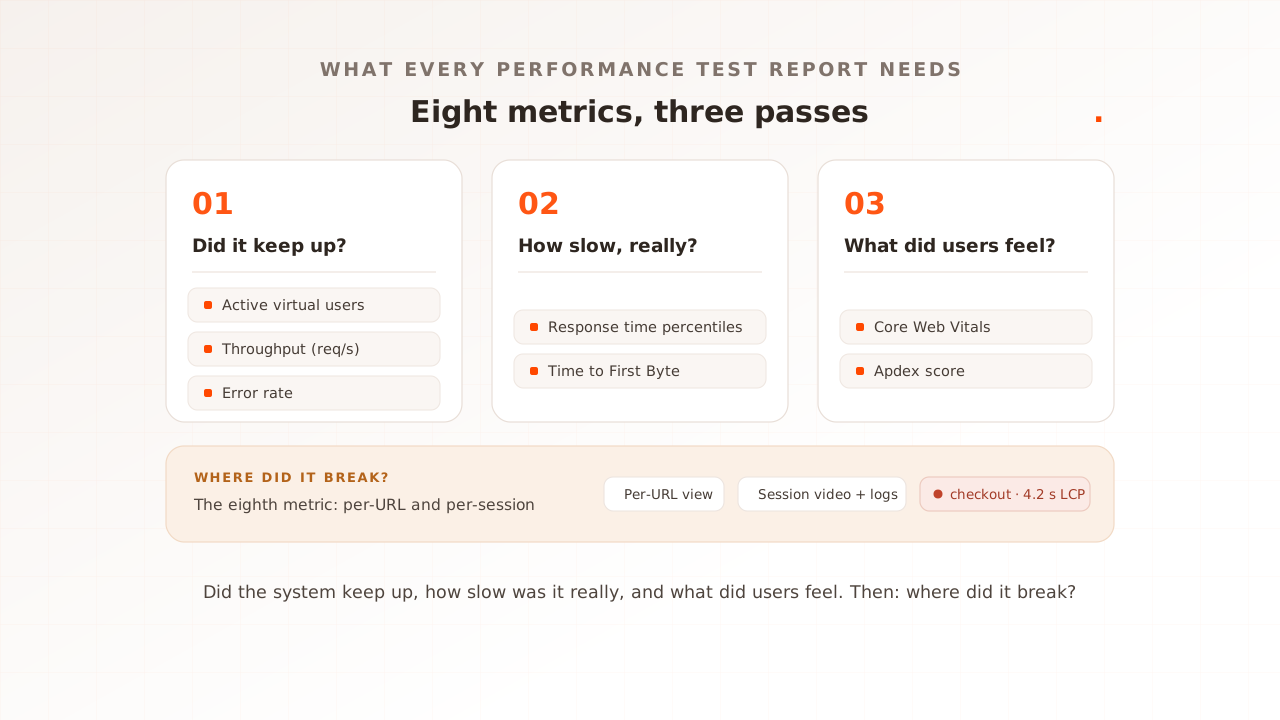
8 metrics every performance test report should include
A performance test report full of green averages can still hide a checkout that buckled at peak. The numbers that catch it come in three passes: did the system keep up, how slow was it really, and what did users feel. Here are the eight metrics that answer those questions, and the benchmark that shows each is healthy.
Ahmad Farzan ·
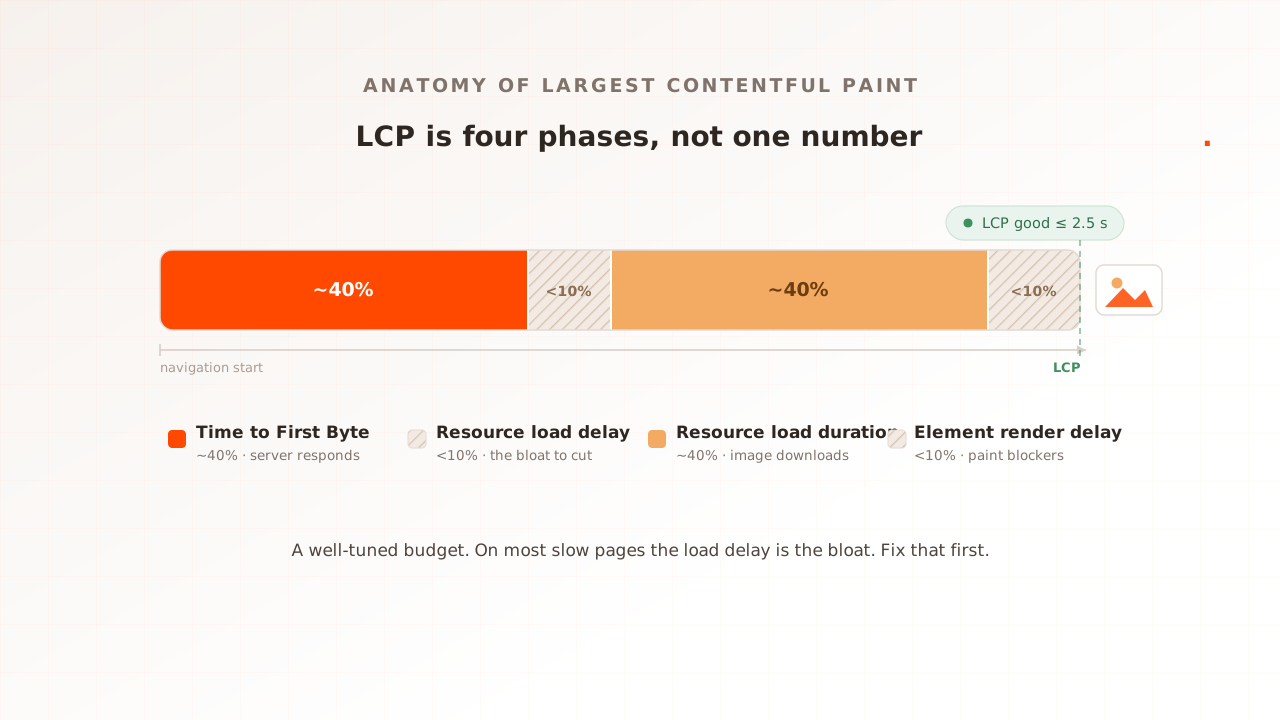
Largest Contentful Paint (LCP), explained for engineers
Your Largest Contentful Paint is the moment the biggest thing on the page, usually the hero image, finishes rendering, and Google treats it as a Core Web Vital. This guide explains what counts as the LCP element, the four phases LCP breaks into, why your lab and field numbers disagree, and how to fix and measure it under real load.
Ahmad Farzan ·