To improve Largest Contentful Paint, find the element that paints last, split its time into four phases, and fix the biggest phase first. On most pages the biggest phase is not a heavy image. It is a late start, where the browser does not begin loading the LCP image early enough. As of the 2025 Web Almanac, only 62% of mobile pages have a good LCP, so close to four in ten ship a hero that arrives too slowly.
This guide is the practical playbook: the fixes in priority order, the code for each, the two 2025 techniques most teams have not adopted yet, and how to confirm the number moved. If you want the concept first, start with Largest Contentful Paint, explained. For the visual-stability companion, see how to improve CLS.
First, find the element and split its time
Every LCP fix starts with two measurements, not guesses: which element is the LCP element, and which of its four phases owns the most time. Optimizing the wrong element, or the right element’s wrong phase, is the most common way to spend a day and move nothing.
Find the element first. Chrome DevTools names it for you: open the Performance panel, record a page load, and the LCP marker points at the exact node. For a quick reading without DevTools, you can test your page speed for free with Evaluat Pulse, which loads the page in a real browser, reports LCP alongside FCP and TTFB, and records the load so you can watch the moment the element paints. Across the web 76% of mobile pages have an image as their LCP element (2025 Web Almanac), so most LCP work lands on image delivery, but confirm yours before you touch anything.
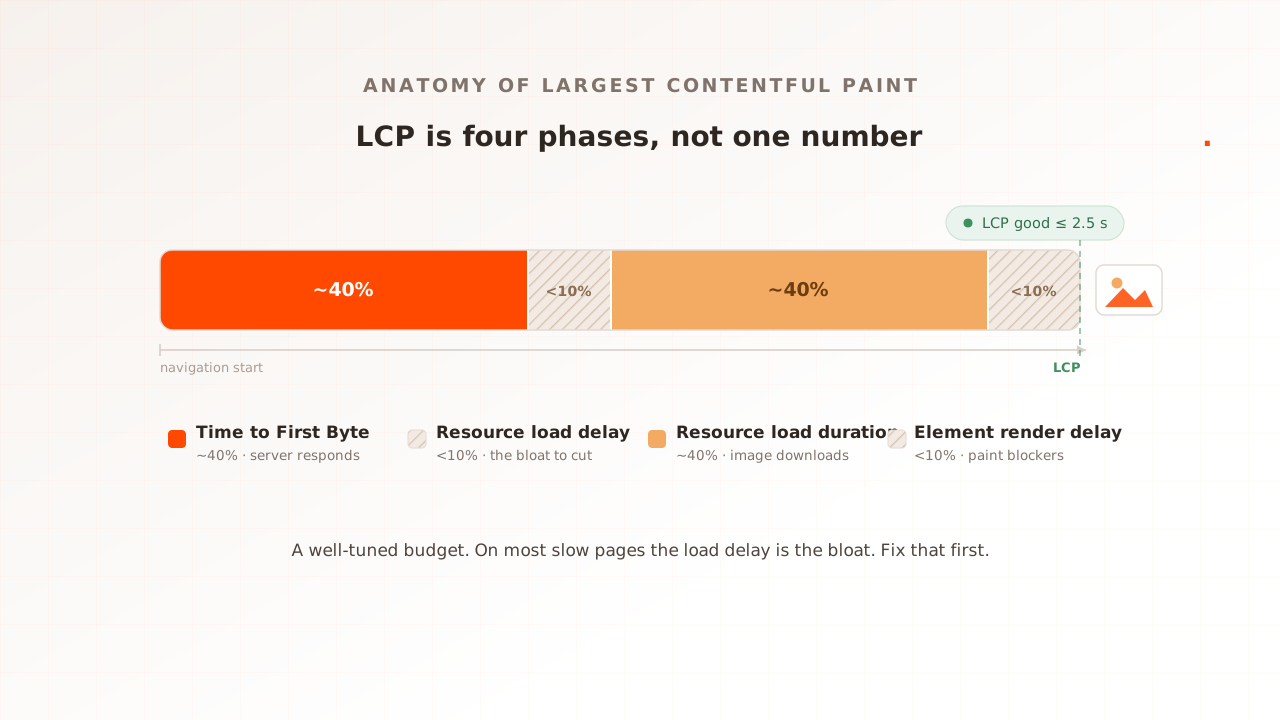
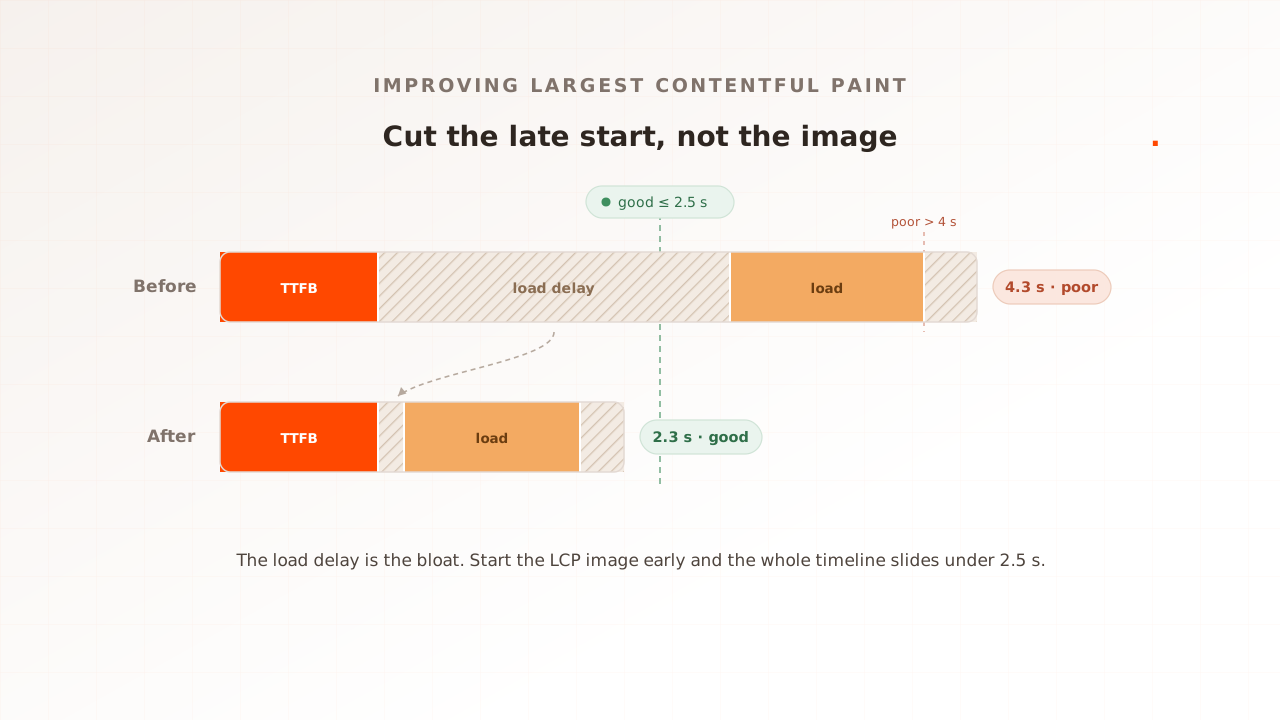
Then split the time. LCP is the sum of four sequential phases: Time to First Byte, resource load delay, resource load duration, and element render delay. web.dev’s ideal split is roughly 40% TTFB, under 10% load delay, about 40% load duration, and under 10% render delay (web.dev, 2025). The full breakdown lives in the LCP explainer; what matters here is the order of attack. And the order is rarely what people expect, because most origins with poor LCP spend less than 10% of their LCP time downloading the image, with the image instead delayed on the client by about 1,290 milliseconds at the 75th percentile (web.dev, 2024). The download is usually a thin slice. The late start is the bloat.
The fixes below are ordered by where the time usually hides.
| Fix, in order | The phase it attacks | The change | Effort vs payoff |
|---|---|---|---|
| Start the LCP image immediately | Resource load delay | Drop loading="lazy", add fetchpriority="high", put it in the HTML | Low effort, usually the biggest win |
| Cut Time to First Byte | TTFB | Cache HTML, serve from the edge | Medium effort, gates everything else |
| Shrink the image download | Resource load duration | AVIF or WebP, srcset, a CDN | Medium effort, only after the load delay is gone |
| Clear what blocks the paint | Element render delay | Defer non-critical JS, inline critical CSS | Medium effort, small but real |
| Prerender the next page | The whole timeline, next navigation | Speculation Rules plus bfcache | Low effort, near-instant repeat navigation |
Step 1: make the LCP image start loading immediately
This is the cheapest, highest-leverage fix, and the one most sites miss. The goal is simple: the browser should discover and request the LCP image as early as possible, in the first pass over the HTML. Get this right and a one or two second load delay can collapse toward zero with no change to the image itself.
Three rules do most of the work. Reference the image in the initial HTML response so the browser’s preload scanner finds it, never lazy-load it, and mark it high priority:
<!-- In the server-rendered HTML, not injected later by JavaScript -->
<img
  src="/hero.avif"
  width="1280" height="720"
  fetchpriority="high"
  decoding="async"
  alt="A clear description of the hero image" />
The numbers say how much room there is here. Roughly 16 to 17% of pages still lazy-load their LCP image, and only 17% of mobile pages with an image LCP use fetchpriority, up from 15% the year before (2025 Web Almanac). Both are self-inflicted late starts.
If the image is set in CSS or injected by a script, the preload scanner cannot see it, so add an explicit preload in the <head>:
<link rel="preload" as="image" href="/hero.avif" fetchpriority="high" />On a framework, use the built-in hint rather than hand-rolling it. Next.js exposes priority on next/image (<Image src={hero} alt="..." priority />), which sets eager loading and high fetch priority together; Astro’s <Image> takes loading="eager". Verify it worked in the DevTools network waterfall: the LCP image request should begin near the very start, not after a stack of scripts.
Step 2: cut Time to First Byte
TTFB is the first phase and, on a well-tuned page, the largest, around 40% of LCP. Nothing downstream can start until the first byte of HTML arrives, so this phase gates the other three. If your server takes 800 milliseconds to respond, no amount of image work gets you under 2.5 seconds.
The levers are familiar. Cache the HTML and your API responses so a request does not rebuild the page from scratch. Serve from an origin or CDN edge in the region closest to your customers, so the bytes travel a short distance. And remove slow synchronous work from the request path: an uncached database query, a third-party call, a cold serverless function.
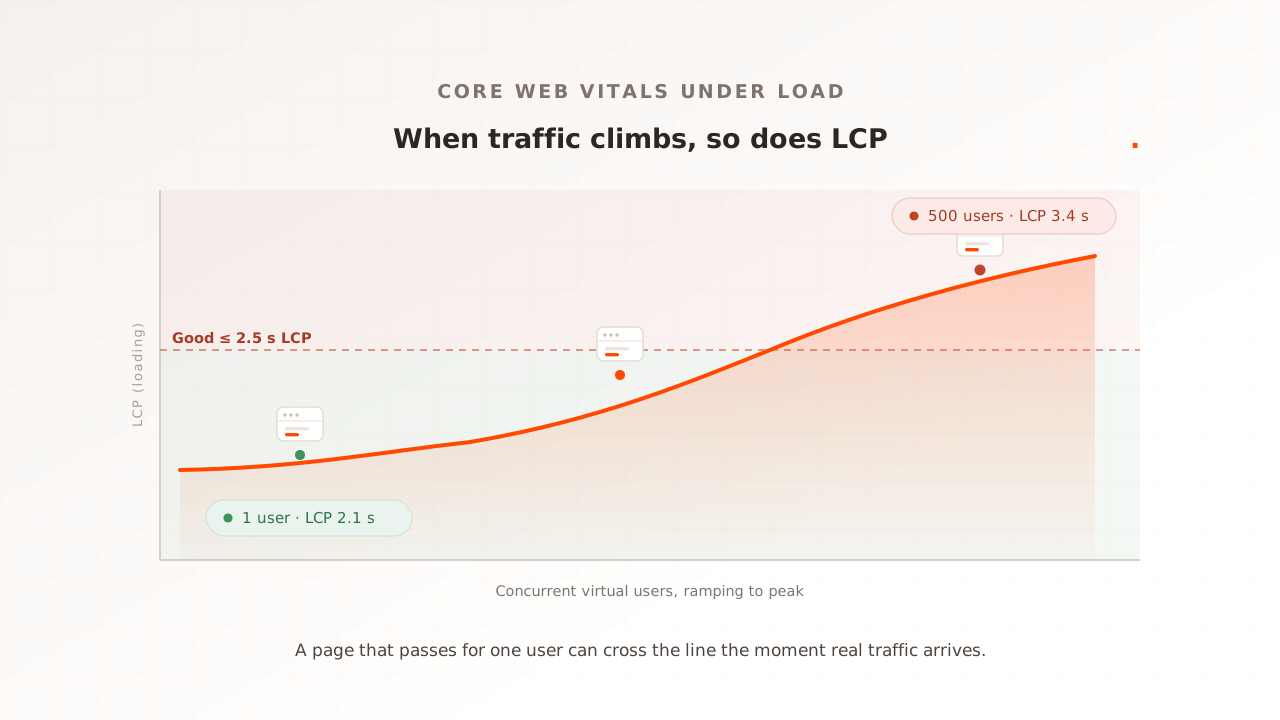
One caveat that single-user testing hides: TTFB is the phase that gets worse under load. As concurrency rises the server queues requests, and the first byte that arrived in 200 milliseconds for one idle visitor can take a second or more at peak. A green TTFB in a quiet lab is not a green TTFB on sale day, which is why the final step is to measure under realistic load, not just once.
Step 3: shrink the image download
Once the request starts on time, make the download quick. This is the classic “optimize your images” advice, and it is real, but it belongs third, not first, because it only helps after the load delay is gone.
Serve a modern format and size the image to the device. Converting to AVIF or WebP is the single biggest file-size win: in DebugBear’s testing on the MDN blog, an LCP image dropped 95%, from 1 MB to 46 KB, on conversion to AVIF (MDN, 2025). Then use responsive srcset so phones do not download desktop pixels:
<img
  src="/hero-1280.avif"
  srcset="/hero-640.avif 640w, /hero-1280.avif 1280w, /hero-1920.avif 1920w"
  sizes="(max-width: 700px) 100vw, 1280px"
  width="1280" height="720"
  fetchpriority="high"
  alt="A clear description of the hero image" />
Always set width and height (or an aspect ratio) so the browser reserves space and the image does not shift layout in late, and serve it from a CDN so the bytes start close to the user. Keep the encoded image roughly matched to its display size; a 4000-pixel-wide photo in an 800-pixel slot is wasted download.
Step 4: clear what blocks the paint
The element has arrived but has not painted. The render delay should be under 10% of LCP, and when it is not, the cause is almost always render-blocking resources in the <head> or fonts that reflow text after it appears.
Three fixes cover most cases. Defer non-critical JavaScript with defer or type="module" so scripts stop blocking the parser. Inline the small amount of CSS needed to render the top of the page and load the rest asynchronously, so the browser is not waiting on a full stylesheet to paint the hero. And set font-display: swap on web fonts so text paints immediately in a fallback face instead of staying invisible while the font downloads. None of these change the LCP element itself; they remove the things standing between its bytes and the screen.
Step 5: make the next navigation instant
The first four steps speed up the current page. The newest lever speeds up the next one, and it is the technique most teams have not turned on yet. The Speculation Rules API lets Chrome prerender a page the user is likely to visit, in the background, before they click. When they do click, the page is already rendered, so it appears almost instantly and its LCP is effectively zero.
You declare the rules in a small script tag, with an eagerness setting that trades coverage against server cost:
<script type="speculationrules">
{
  "prerender": [{
    "where": { "href_matches": "/*" },
    "eagerness": "moderate"
  }]
}
</script>
The payoff is documented. Monrif cut LCP by up to 17.9% and lifted engagement by up to 8.9% by pairing Speculation Rules prerendering with back/forward cache support (web.dev, 2025). The back/forward cache (bfcache) is the companion win: it restores a fully rendered page from memory on back and forward navigations, with a sub-second LCP, as long as you avoid unload listeners. Start with moderate eagerness on safe, idempotent links, watch your server load, and widen from there.
Verify the fix held: at the 75th percentile, and under load
A fix you cannot measure is a guess. After each change, confirm the number moved where it counts: in the field, at the 75th percentile, and under realistic concurrency.
Read field LCP with Google’s web-vitals library, which wraps the browser’s native measurement, and report it at the 75th percentile rather than the mean, because the published threshold is the 75th percentile (web.dev, 2025) and an average hides the slow tail:
import { onLCP } from 'web-vitals';

onLCP(({ value, rating }) => {
  // send value to your analytics; aggregate at p75, not as an average
  console.log(value, rating); // e.g. 2180, "good"
});
Two numbers will disagree, and that is expected: lab tools run one visitor on a quiet server, while field data reflects real devices, networks, and a busy origin. Core Web Vitals: lab vs field explains which to trust for what. The dimension a single lab run cannot reproduce is concurrency, and it is the one that bites in production, because TTFB swells as load rises. Re-running the page in a real browser at realistic load is how you catch an LCP that is fine for one user and poor at peak; that is the subject of measuring Core Web Vitals at load. To stop a fix from quietly regressing later, wire the check into CI as a budget, covered in performance regression testing.
Common mistakes when improving LCP
The same handful of errors waste most LCP effort. Each has a one-line fix.
- Optimizing the wrong element. Swapping the hero does nothing if the LCP node is a heading. Confirm the element in DevTools before you touch it.
- Lazy-loading the LCP image.
loading="lazy"on the element that should paint first guarantees a late start. Lazy-load below the fold, never the LCP. - Compressing the image before fixing the load delay. A smaller file that still starts loading two seconds in is still slow. Fix the start time first, the size second.
- Preloading a second large image. A preload that competes with the real LCP image for bandwidth slows the one that matters. Preload the LCP image only, and only when it is discovered late.
- Testing one idle user in the lab. A 1.8-second Lighthouse score says little about the 4-second LCP your users get at peak. Lab has no concurrency.
- Reporting the average. The mean flatters you by hiding the slow quarter. Track and gate on the 75th percentile.
Where Evaluat fits
Most of the steps above you can do with free tools: DevTools to find the element and split the phases, Evaluat Pulse for a quick single-page reading in a real browser, Lighthouse or DebugBear for a lab audit. Use them; they are the right tools for a single page on a quiet server.
Evaluat is built for the part those miss: what your LCP does when real traffic arrives. Each virtual user runs in its own isolated browser, so the LCP it records is the browser’s native value, captured while hundreds of users hit the site at once. When LCP crosses 2.5 seconds at peak, the per-session network log shows exactly when the image was requested and how long it took, and the session video shows the moment it painted, so a late start and a slow download read as the two different problems they are. How it works covers the architecture.
One honest boundary: if you are load-testing a pure API with no page to render, a protocol tool like k6 is the lighter fit. Evaluat earns its place when the question is what a controlled real browser records under selected load conditions, not whether a server returns 200s. Field data remains the source for the full customer population.
Improving LCP is not a single trick. Find the element, split it into four phases, and fix the earliest, largest one first, which is usually the load delay and not the image. Then prove the fix held in the field, at the 75th percentile, under the load your users actually bring.
Test in real browsers. Debug in real sessions. Book a demo.