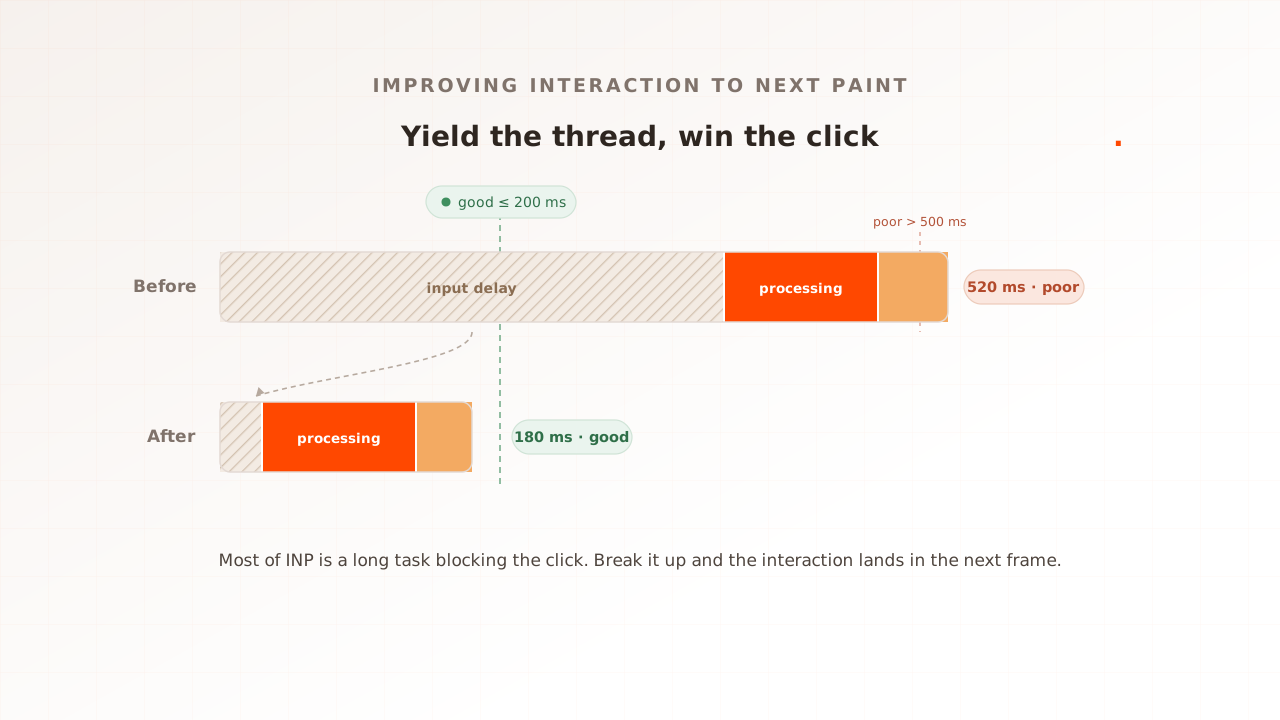
To improve Interaction to Next Paint, find your slowest interaction, split its latency into three phases, and fix the phase that owns the most time. A frequent, high-leverage offender is a long task that was already running on the main thread when the user clicked: the interaction has to wait for that task to finish before the handler can even start. The fix there is rarely a faster handler. It is a thread that was free when the click arrived.
Responsiveness is largely a mobile problem. In the 2025 Web Almanac, 77% of mobile websites had good INP against 97% on desktop, up from 74% on mobile the year before (HTTP Archive, 2025). The gap is CPU: a phone runs the same JavaScript several times slower, so the same long task blocks the same click for longer.
This guide is the practical playbook: the fixes in priority order, the code for each, the modern API most teams have not turned on yet, and how to confirm the number actually moved for real users. If you want the concept first, what counts as an interaction and why INP replaced First Input Delay, start with Interaction to Next Paint, explained. This is the how, not the what.
First, find the slow interaction and split its time
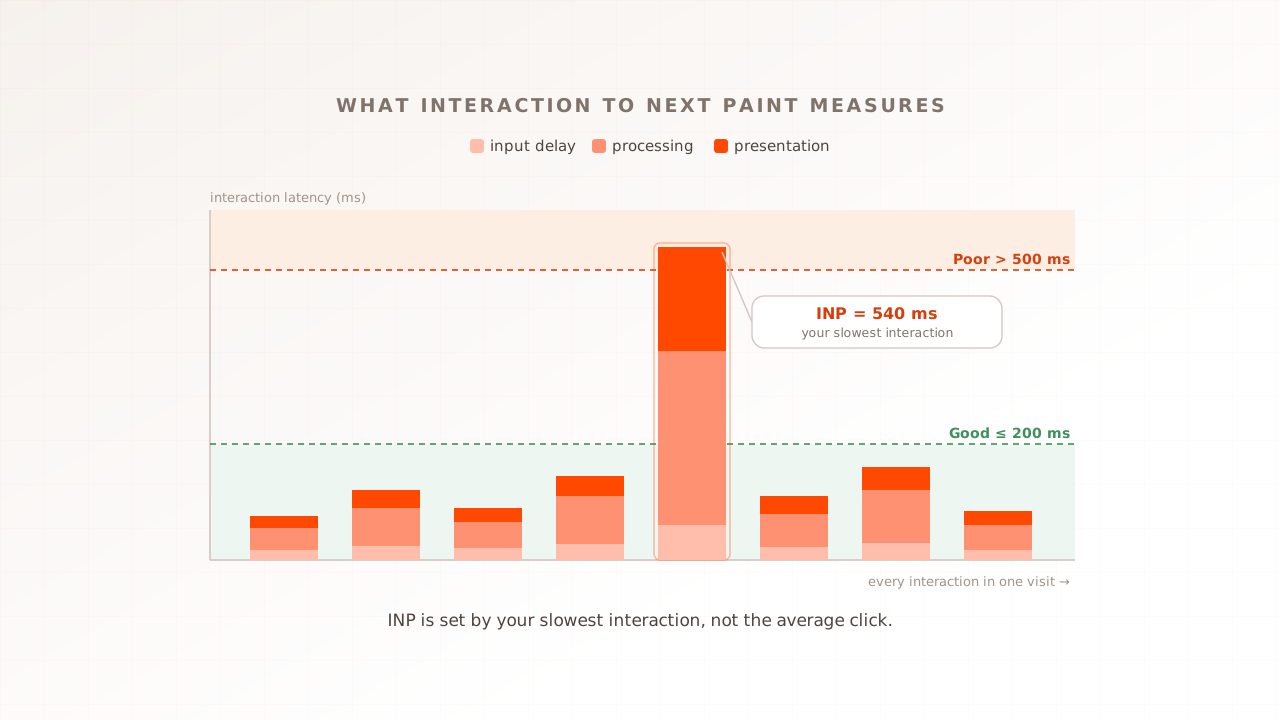
Every INP fix starts with a measurement, not a guess: which interaction is your slowest, and which of its three phases owns the most time. INP is the sum of three sequential phases, defined in web.dev’s guide to optimizing INP (web.dev, 2025): the input delay, from the moment the user acts until the event callbacks begin to run; the processing duration, the time those callbacks take to finish; and the presentation delay, the time for the browser to paint the next frame showing the result.
Find your slowest interaction in the field, because that is what INP reports. Google’s web-vitals library has an attribution build that names the culprit: the target element, the phase breakdown, and the event type.
import { onINP } from 'web-vitals/attribution';

onINP(({ value, attribution }) => {
  // value is the INP in ms; attribution says which interaction and which phase
  console.log(value, attribution.interactionTarget);
  console.log(attribution.inputDelay, attribution.processingDuration, attribution.presentationDelay);
});
Locally, Chrome DevTools shows the same split: record in the Performance panel, trigger the interaction, and the Interactions track breaks it into the three phases and points at the long tasks in the way. One caveat shapes everything below: a cold page load has no interaction, so lab tools cannot measure INP from a standard run. You measure it in the field, or with scripted interactions that perform the actual clicks.
The fixes below are ordered by leverage, cheapest and highest-payoff first. Apply the ones that target your largest phase, since the breakdown differs from page to page.
| Fix, in order | The phase it attacks | The change | Effort vs payoff |
|---|---|---|---|
| Break up long tasks, yield the thread | Input delay | Split work into chunks, scheduler.yield() between them | Low effort, usually the biggest win |
| Trim the event handler | Processing duration | Do the visual-critical work now, defer the rest | Medium effort, real on heavy handlers |
| Audit and defer third-party scripts | Input delay and processing | Remove, defer, or facade analytics, consent, and chat tags | Medium effort, often overlooked |
| Cut presentation delay | Presentation delay | Batch DOM reads and writes, shrink the DOM | Medium effort, smaller but real |
| Fix the hydration trap | Input delay, first interactions | Ship less JS, code-split, hydrate progressively | Higher effort, fixes early taps |
Step 1: break up long tasks and yield to the main thread
This is the highest-leverage fix, and the one most pages need. A long task is any task that runs longer than 50 milliseconds (web.dev, 2025), and while it runs the main thread is blocked, so a click that arrives mid-task sits in input delay until the task finishes. Break the long task into smaller pieces and hand control back to the browser between them, and a waiting interaction can run in the gap.
The modern way to yield is scheduler.yield(). The detail that matters is what it does that an old setTimeout(0) does not: scheduler.yield() resumes your work at the front of the queue (Chrome for Developers, 2025), so you give the browser a chance to handle a pending interaction without sending the rest of your own work to the back of the line.
async function saveSettings() {
  const tasks = [validateInput, persistToStore, renderTable, sendAnalytics];

  for (const task of tasks) {
    task();
    // hand control back so a waiting click can run, then resume
    await yieldToMain();
  }
}

function yieldToMain() {
  if ('scheduler' in window && 'yield' in scheduler) {
    return scheduler.yield();
  }
  return new Promise((resolve) => setTimeout(resolve, 0));
}
scheduler.yield() is not yet Baseline. As of 2026 it ships in Chrome and Edge 129 and Firefox 142, but Safari does not support it (MDN, 2026), which is why the setTimeout fallback above matters: it yields too, just without the front-of-queue priority. Verify it worked by recording the interaction again in DevTools. The single long task should now be several short ones, with the interaction running between them.
The payoff is not hypothetical. Trendyol traced a slow interaction to a single 700 to 900 millisecond long task in an Intersection Observer callback, deferred it with exactly this scheduler.yield() and setTimeout pattern, and cut their mobile INP by 50%, from 963 ms to around 481 ms, which lifted click-through by 1% (web.dev, 2023).
Step 2: trim the work in the event handler
When the processing duration is the largest phase, the handler is doing too much synchronously. The goal is to do only the work that produces the frame the user is waiting for, and defer everything else until after that frame paints.
Separate the urgent from the rest. Update the thing the user touched now, then push analytics, prefetching, and non-visual state into a later task with scheduler.postTask() or a requestAnimationFrame followed by a timeout. In React, mark the non-urgent update as a transition (React, 2026) with startTransition or useDeferredValue, so the framework keeps the UI responsive mid-render instead of blocking on a large re-render:
import { startTransition, useState } from 'react';

function handleChange(value) {
  setQuery(value);                  // urgent: the input reflects the keystroke now
  startTransition(() => {
    setResults(search(value));      // non-urgent: React can interrupt this for new input
  });
}
Avoid the trap of one giant click handler that validates, mutates state, triggers a synchronous re-render, and logs, all before the browser can paint. Each of those is a candidate to defer.
Step 3: audit and defer third-party scripts
Third-party scripts are a major source of the long tasks that inflate input delay, because analytics, consent, A/B, and chat tags often attach listeners that run on every interaction. The scale is easy to underestimate: in the 2024 Web Almanac, the median mobile page already spent 2,366 ms in long tasks, and the slowest quarter spent over 4,400 ms (HTTP Archive, 2024). A measurable share of that is not your code.
Audit it in the DevTools Performance panel: attribute each long task to its source script, and you will usually find a tag you can defer, lazy-load behind a facade, or remove outright. The worst offenders tend to be the most common ones. In the 2022 Web Almanac, Google Tag Manager blocked the main thread on 75% of the mobile pages that included it, and Google Analytics on 70% (HTTP Archive, 2022). Load what you can after the page is interactive, and gate heavy embeds such as chat, video, and maps behind a click-to-load placeholder so they never run during the first, busiest seconds.
Step 4: cut presentation delay
The handler has run, but the frame has not painted. A long presentation delay usually means the interaction forced expensive layout or rendering work before the browser could draw.
The classic cause is layout thrashing: reading a layout property such as offsetWidth, writing to the DOM, then reading again, which forces the browser to recalculate layout repeatedly within a single frame. Batch your reads, then your writes, so the browser lays out once. Beyond that, a large or deeply nested DOM makes every recalculation slower, so trimming the node count helps directly, and CSS content-visibility: auto lets the browser skip rendering work for off-screen content. Set width and height on images and media so a late-arriving asset does not reflow the page after the interaction lands.
Step 5: fix the hydration trap
The first four steps assume the page is loaded and idle. The hardest INP problems happen earlier, in the seconds after a server-rendered page appears but before it is interactive. The HTML paints fast, so the page looks ready, but the framework is busy on the main thread attaching event listeners and rebuilding state, a step called hydration. A tap in that window sits in a long input delay. As web.dev’s guide to rendering on the web puts it, server-side rendering with rehydration can have a significant negative impact on INP even when it improves first paint (web.dev, 2026).
There is no one-line fix, because the cause is the amount of JavaScript you ship and execute. The levers are structural: send less JavaScript, code-split so a route hydrates only what it shows, and hydrate progressively or lazily so below-the-fold and non-interactive components do not compete for the main thread on load. Architectures that hydrate selectively, such as islands, exist specifically to keep this window short. If your INP is worst on the first interaction and fine afterward, suspect hydration before you tune a handler.
Verify the fix held: at the 75th percentile, and under load
A fix you cannot measure is a guess. After each change, confirm INP moved where it counts: in the field, at the 75th percentile, and under realistic concurrency.
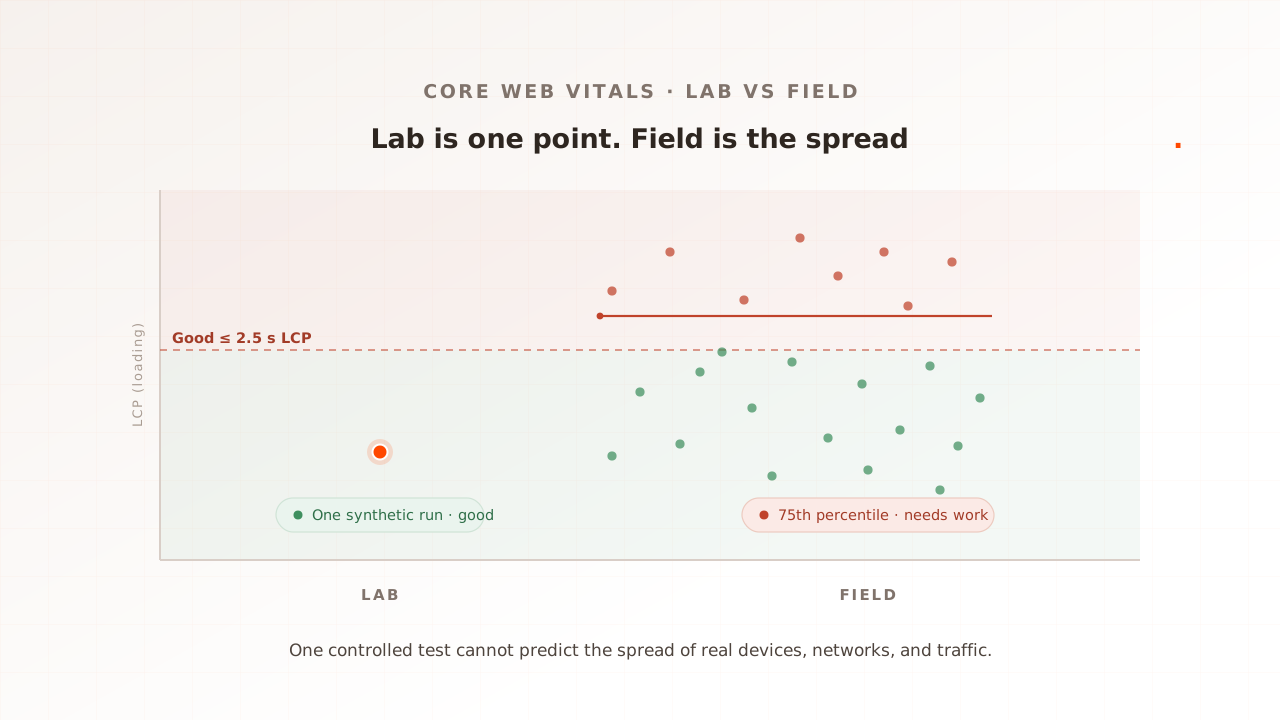
Report field INP at the 75th percentile, not the mean, because the published good threshold is 200 ms at the 75th percentile (web.dev, 2025) and an average hides your slowest interactions, which are exactly the ones INP exists to catch. Read it from the Chrome User Experience Report or from the web-vitals attribution build wired into your analytics.
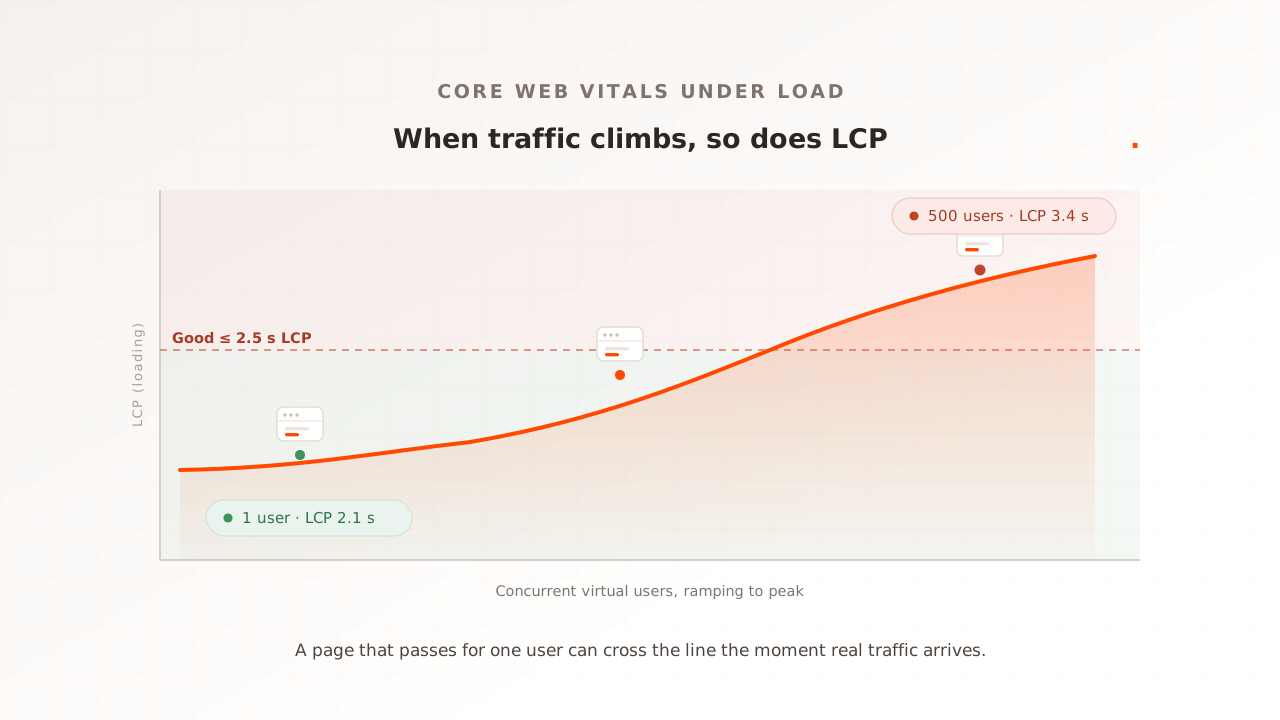
Two readings will disagree, and that is expected. A lab tool runs one interaction on one controlled machine, while the field reflects a distribution of real devices, networks, and main-thread workloads. Core Web Vitals: why lab scores differ from real users explains which to trust for what. A single run also cannot load shared backends, CDNs, and third parties. Under concurrency those services can queue work, delaying hydration or network-bound interactions in each independent browser. Reproducing that needs real browsers performing real interactions while the shared system is under load, which is the subject of measuring Core Web Vitals at load. To stop a fix from quietly regressing later, use existing CI tooling as covered in performance regression testing; Evaluat’s managed Testing Suite and CI gates are planned.
Common mistakes when improving INP
The same handful of errors waste most INP effort. Each has a one-line fix.
- Tuning the handler when the delay is elsewhere. If the time is in input delay, a faster handler changes nothing. Split the interaction into phases before you optimize.
- Reporting the average. The mean hides your slowest interactions, which are what INP measures. Track and gate on the 75th percentile.
- Testing one idle user. A single interaction does not stress shared backends or third parties. Independent devices do not share a main thread, but peak latency in shared services can still delay each browser’s interaction.
- Only testing on a fast laptop. INP is largely a mobile problem, 77% of mobile sites passing against 97% on desktop in the 2025 Web Almanac. Test with mobile-class CPU throttling.
- Micro-optimizing your code while a tag dominates. A third-party script can own more main-thread time than anything you wrote. Audit before you refactor.
- Sprinkling
scheduler.yield()everywhere. Yielding has a cost and only helps where a long task blocks an interaction. Find the long task, then break it up.
Where Evaluat fits
Most of the steps above use free tools: DevTools to split an interaction into its phases, the web-vitals library to read field INP at the 75th percentile, your framework’s profiler for handler work. Use them. They are the right tools for one page and one developer.
Evaluat is built for the dimension those miss: what your INP does when real traffic is interacting at once. Each virtual user runs in its own isolated browser and performs the real clicks and taps of the journey, so the INP recorded is the browser’s native value, captured at the concurrency you expect. When an interaction stalls at peak, the per-session network and console logs show what the main thread and backend were doing at that moment, and the session video shows the click that waited, so a long input delay and a slow handler read as the two different problems they are. How it works covers the architecture.
One honest boundary: INP is a browser metric. If you are load-testing a pure API with no interface to interact with, a protocol tool like k6 is the lighter, cheaper fit. Evaluat earns its place when the question is what a controlled real browser records under load; field data remains the source for what the full user population experienced.
Improving INP is not one trick. Find your slowest interaction, split it into input delay, processing, and presentation, and fix the largest phase, which is most often a long task standing between the click and the handler. Then prove it held in the field, at the 75th percentile, under the load your users actually bring.
Test in real browsers. Debug in real sessions. Book a demo.