Checkout at peak
A checkout that slows under peak traffic sheds buyers at the exact moment you have the most of them. Rehearse it at Black Friday concurrency and find the point where it starts to drag.
You find it before your customers do. Evaluat sends real browsers through your real customer journeys, homepage to checkout, at the numbers you expect on your biggest day. Every virtual user is a real browser. You get a verdict in plain language; your engineers get the evidence: Web Vitals, network logs, console logs, and video for every session.
Performance Testing is available through assisted private access. Testing Suite and Monitoring are planned.
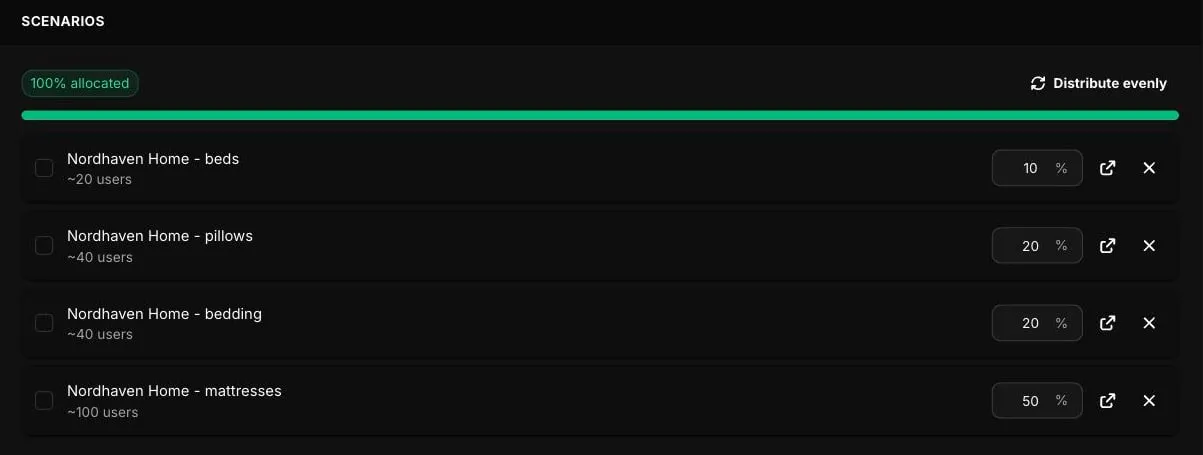
Evaluat is performance testing that runs real browsers. A test starts with a scenario: the customer journey you want to rehearse. Homepage to checkout. Search and add to cart. Login and load the dashboard. You build it once in the visual step editor: add the steps, point them at your pages, and verify the journey with a live preview run. No scripts.
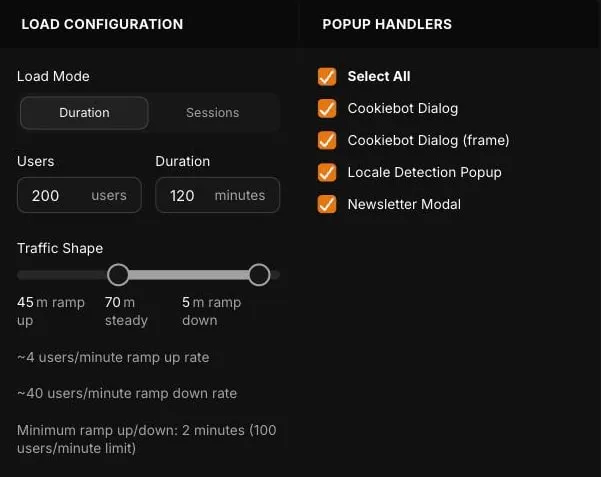
Then pick how the crowd arrives: ramp visitors up, hold them at peak, then ramp down. A steep ramp rehearses a surge; a gentle one rehearses a normal day. We size the run to your forecast peak with you on the demo call.
Every virtual user runs in a real browser, in your chosen region, with your chosen locale and viewport. Web Vitals captured at load. Session video, network logs, and console output recorded for every one of them.
Want to see the per-session artifacts before booking anything? The free website speed test runs one page load the same way: same browser, same vitals, same video, on a shareable report.
One test, many names. What Evaluat calls performance testing covers what other tools split into load, stress, spike, and soak tests. The difference is the traffic shape you choose, not a separate product: expected traffic held steady is a load test, pushing past it is a stress test, a steep surge is a spike test, a long hold is a soak test. Same scenarios, same report, different dials.
Every performance test in Evaluat is built from the same six pieces. The dials are the same on every plan; plan limits scale with the tier.
Evaluating for someone else? Send this page and How it works to your engineering lead. The demo works best with both of you on the call.
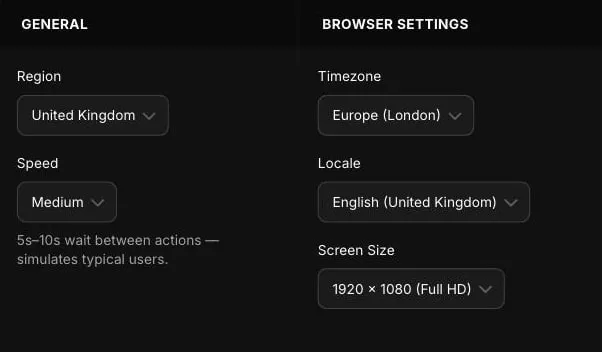
A scenario you build for a 1,000-user performance test is designed to become a deployment smoke check in CI and a continuous production monitor when Testing Suite and Monitoring ship. Same definition, same configuration UI, three planned lifecycles, so the maintenance burden stays in one place. Performance Testing is available through assisted private access; Testing Suite and Monitoring are planned.
Parameterise the scenario with datasets so virtual users follow different paths. Wire a project-level popup handler once so the cookie banner doesn't break every script.
More on scenarios
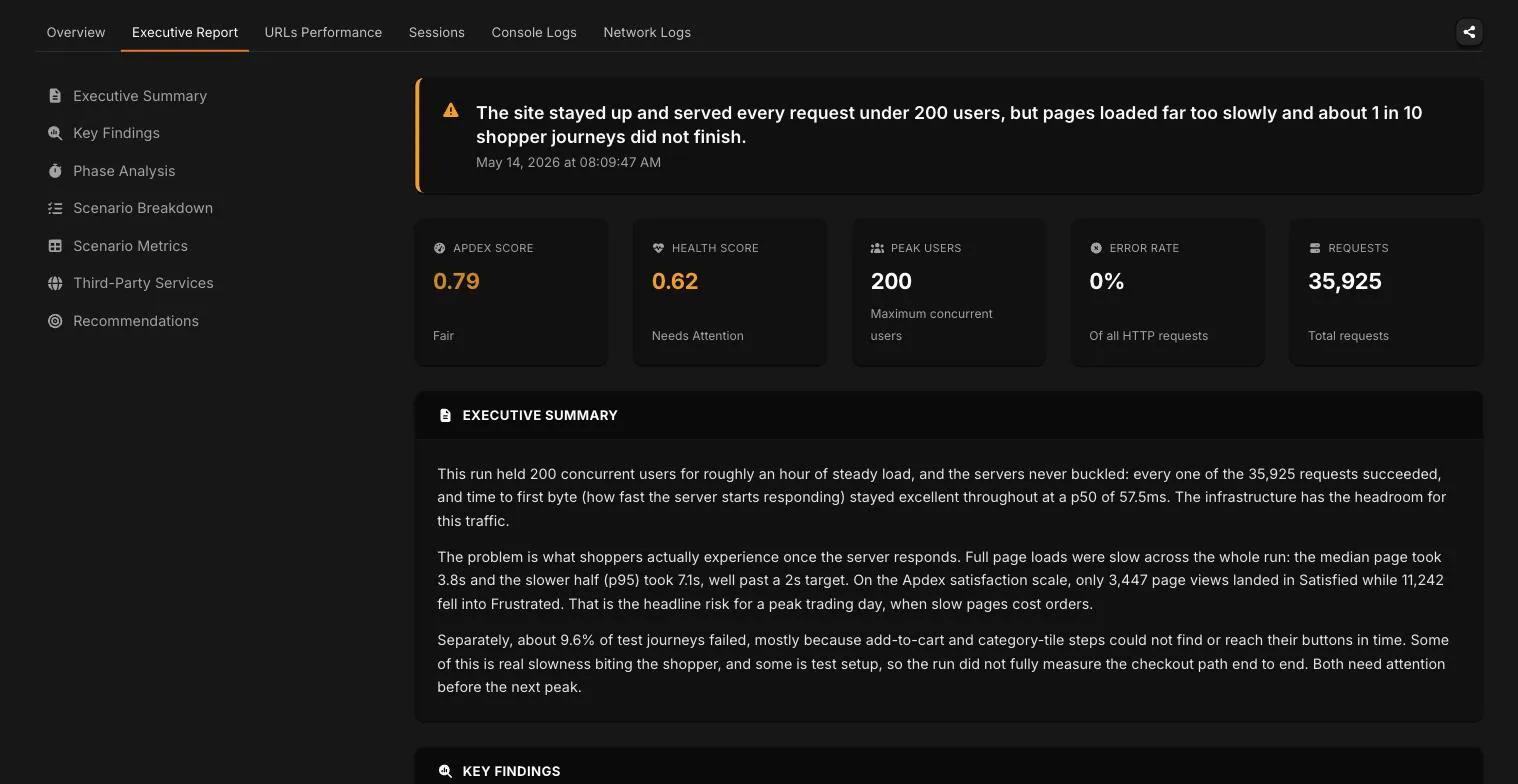
Generate an Executive Summary when you need the verdict in plain language: a health score, the key findings ranked by severity, and recommended fixes. Beside it, five views detailed enough to find why something broke for 10 users out of 1,000.
Reports have stable URLs and can be shared read-only with people outside the team. See an example report.
The patterns we hear most often on demo calls. Forensic detail beats aggregate percentiles, and every one of these is a test you can run today.
A checkout that slows under peak traffic sheds buyers at the exact moment you have the most of them. Rehearse it at Black Friday concurrency and find the point where it starts to drag.
Every click you pay for lands on a page. If LCP climbs while the campaign runs, you paid full price for a visit that never really arrived. Test the landing page at campaign traffic first.
New platform, new theme, new checkout. Rebuilds often ship slower than what they replaced. Run the same journey on old and new, side by side, before you switch.
Analytics, reviews, chat, A/B tests. Each tag is small; together they tax every page view. The report shows what each one costs in LCP and INP under load.
The email goes out, or the spot airs, and everyone arrives in the same five minutes. That shape breaks sites that handle a busy day fine. Rehearse the surge, not just the volume.
Google uses field page-experience signals, including Core Web Vitals, among other ranking factors. Evaluat measures related diagnostics under controlled load, so slow pages that fight uphill for the traffic you don't pay for are easier to find and fix.
Five detail views for engineers: Overview, URL performance, Sessions with video, Console logs, and Network logs. You can generate an Executive Summary your stakeholders can read in two minutes. See what a report contains.
No. You assemble the journey step by step in a visual editor (navigate, click, type, wait) and verify it with a live preview run. Element targets use CSS selectors; datasets and popup handlers keep the journeys realistic without code.
The UK and the EU are live today. Tell us what region you need on the demo call.
CI integration is planned for Testing Suite. Today, Performance Tests run from the UI.
The free Pulse tool loads one page once. Performance Testing rehearses multi-step journeys at your forecast concurrency, with evidence for every virtual user.
Plan-dependent. We size concurrency to your forecast peak on the demo call. Higher concurrency targets are available on Growth and Scale.
More answers on the FAQ page. Shortlisting vendors? Our guide to the best real-browser load testing tools compares the whole field.