What does Black Friday-ready actually mean?
A website is ready for Black Friday when it can serve the peak number of simultaneous shoppers you expect, at speeds they will tolerate, through the journeys that take their money. Readiness is two numbers you can defend: the concurrent load you have proven, and the response times you held while proving it.
The stakes keep growing. Adobe measured 11.8 billion dollars of US online spend on Black Friday 2025, up 9.1 percent on the year before, and Salesforce put global Black Friday online sales at 79 billion dollars (December 2025). Your slice of that arrives compressed into hours. When the site cannot serve it, the loss is just as compressed: Splunk and Oxford Economics put the average cost of unplanned downtime at 15,000 dollars a minute in their 2026 study of large companies, and Black Friday minutes are worth far more than average minutes.
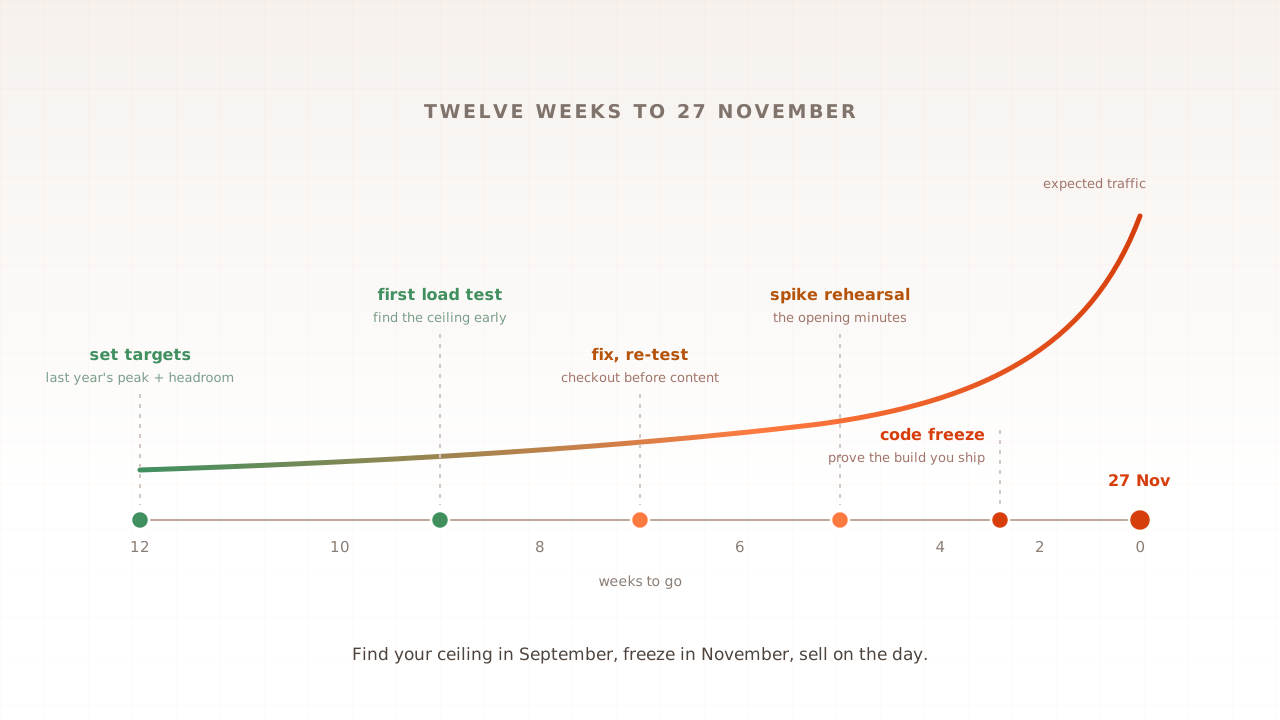
Being ready is not a feeling, and it is not a green Lighthouse score from a quiet Tuesday. It is a rehearsal with evidence. That is what the next twelve weeks are for. If you are reading this on publication day, Black Friday 2026 is just over twelve weeks away, so week 12 is this week; start today.
What do you need before you start?
You need four things before week 12 starts, and none of them is a tool purchase. Gather them in an afternoon and every later step gets easier: the data to size from, an environment to test against, a way to generate realistic load, and one person who owns the countdown.
- Last year’s analytics, or an honest substitute. The plan sizes everything from your own peak hour. A store with no history sizes from its marketing reach instead, covered in the next section.
- An environment you are allowed to break. Production in a quiet window with an agreed abort rule, or a staging environment that genuinely resembles production. A staging box with half the servers and a tenth of the catalogue proves half a ceiling at best.
- A load testing tool that can walk a journey, browse, search, cart, checkout, rather than only hammering URLs. If the term is new, start with what load testing is and come back; this plan assumes no prior testing background beyond that.
- A named owner. Not a committee. One person who tracks the countdown, chases the fixes, and has the authority to call the freeze.
Agree one more thing up front: what “acceptable” means. A number nobody wrote down cannot fail, and that is exactly why targets get skipped. Write yours down in week 12.
Weeks 12 to 10: set your targets from last year’s numbers
The first job is arithmetic, not engineering: turn last year’s traffic into this year’s test target. Open your analytics, find the busiest hour of last year’s Cyber Week, and write down three numbers: sessions in that hour, average session duration, and orders in that hour. Those three produce your target.
Concurrent users, the number that actually loads your servers, comes from a simple formula: sessions per hour multiplied by average session duration in minutes, divided by 60. If your peak hour last year saw 12,000 sessions averaging five minutes, you were carrying about 1,000 concurrent shoppers. That is your baseline, not your target.
Now add headroom. Traffic grows, and promotions concentrate it: 20 to 50 percent on top of last year’s peak is a sane starting band, with the higher end if your discounts or ad spend are up. The pattern to respect is concentration. Adobe’s hour-by-hour data shows money arriving in narrow windows, with Black Friday 2025 running around 12.5 million dollars through US carts every minute between 10am and 2pm, so an average-day target is the wrong target.
| Number to write down | Where it comes from | Example |
|---|---|---|
| Peak concurrent users | Peak-hour sessions x duration (min) / 60 | 1,000 |
| Test target | Peak concurrent users + 20-50% headroom | 1,300-1,500 |
| Acceptable speed | The response times you will defend at peak | Product page under 2s, checkout steps under 3s |
| Revenue per peak minute | Peak-hour revenue / 60 | Your number, on the wall |
That last row is the one that gets budget approved. When a fix costs a week, compare it to what a down minute costs you.
No trading history yet? Size from reach instead. Estimate the shoppers your launch email and ads will land in the first hour: list size times open rate times click-through, plus expected ad clicks. Treat that as your peak-hour sessions and run the same formula. The number will be rough, which is fine, because the plan’s next step is to find the real ceiling by test rather than by faith. And whatever your history says, scale the headroom with the aggression of the promotion: a 40 percent site-wide discount announced to your whole list does not produce last year’s curve plus a little. It produces a sharper, taller one.
Weeks 10 to 8: find your ceiling with a first load test
By ten weeks out, run a real load test: simulated shoppers moving through the same journeys as real ones, browse, search, add to cart, check out, ramped up to your target and then past it until something bends. The point of going early is brutal and simple. Whatever this test finds, you still have time to fix it. The same discovery in November is just bad news.
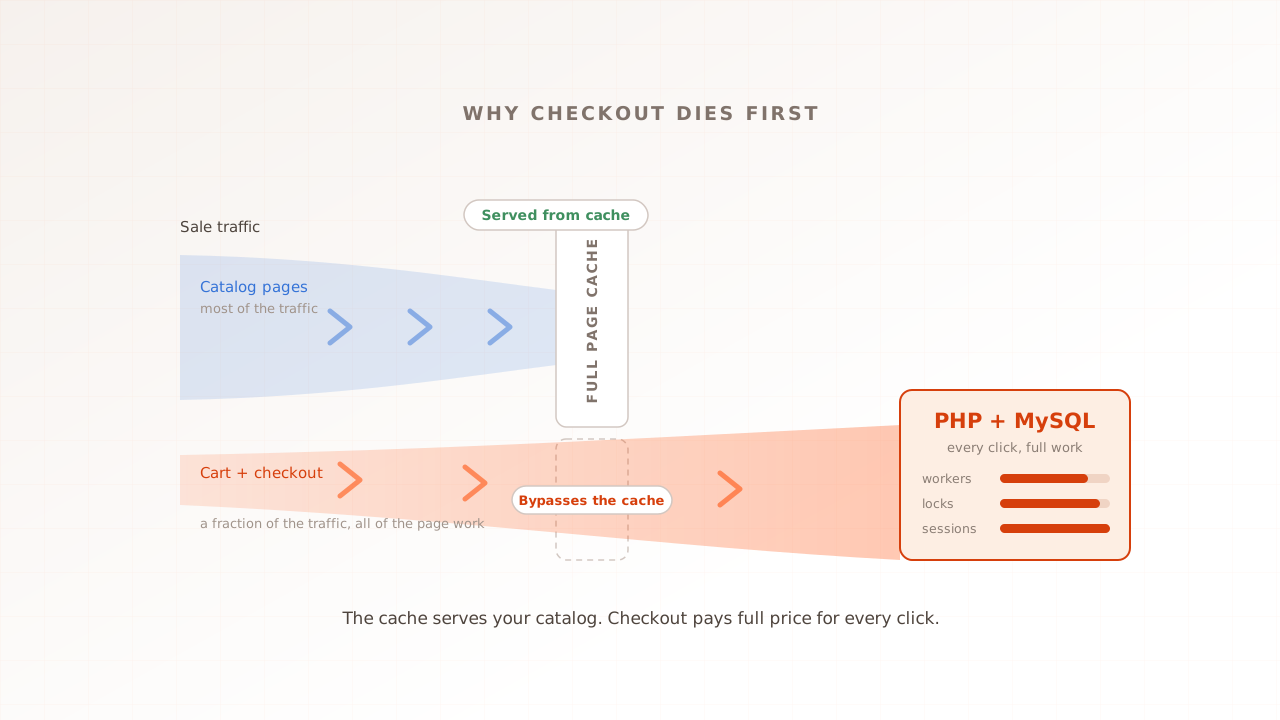
Two rules make the first test honest. Test journeys, not pages: a homepage test mostly measures your cache, because a CDN serves the cacheable pages while cart and checkout hit your origin uncached. And test at realistic pace, with pauses between clicks the way real shoppers behave, so the load pattern matches the day. Our walkthrough of how a load test actually runs covers scenario design step by step; the short version is that the test should look like your Saturday traffic, sped up.
Run the test as a ramp, not a wall: climb toward the target over ten minutes or more, hold the plateau long enough to trust the reading, and keep think time in the scenario, the natural pauses while a person reads a page or types a card number, so the request pattern matches human traffic. Then keep ramping past the target until you find the edge. A practical stopping rule: the test has found the ceiling when the slow tail of response times bends sharply upward or errors pass one percent of requests, whichever comes first.
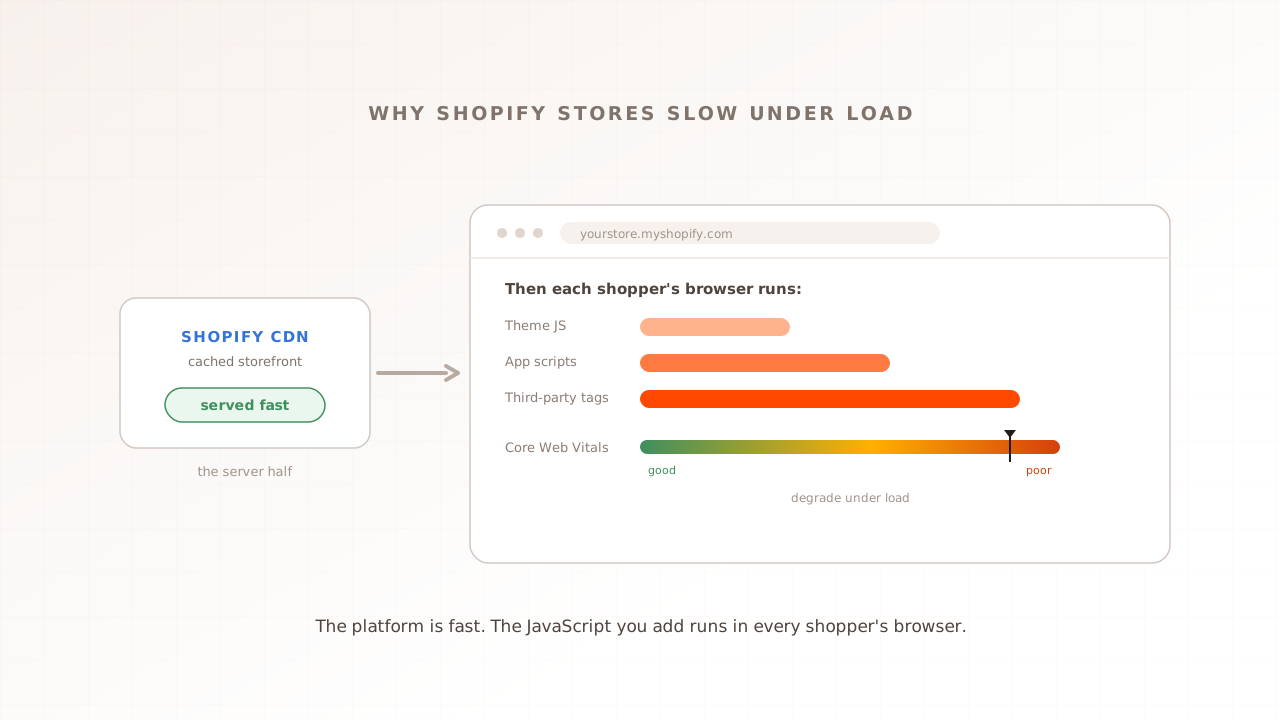
Read the result as a curve, not a verdict. As simulated shoppers climb, response times stay flat, then bend, then break. The bend is your ceiling. If it sits below your target from week 12, the gap is your work list. This is also where testing with real browsers earns its keep: measuring what shoppers actually experience at load, page by page, session by session, rather than only how fast the server answered. That evidence is the difference between “the API held” and “the checkout was unusable on mobile”. A failure at peak isn’t a percentile. It’s a session.
Weeks 8 to 6: fix what the test exposed, then prove it again
Fix in revenue order. The paths that take money, checkout, cart, login, stock checks, come first; content pages can be slow without costing a sale. This ordering matters because the money paths are precisely the ones your cache cannot save, and they are usually where the first test bends.
The usual suspects, roughly in the order they surface: database queries that were fine at ten users and quadratic at a thousand, undersized connection pools, site search hammering the database, and third-party calls (payments, tax, shipping rates) that slow down exactly when everyone else is also having their busiest day. Platform specifics matter too; if you run Magento, the way checkout saturates first while cached pages stay fast is its own story.
Give mobile its share of attention while you are here. Adobe measured 57.5 percent of Cyber Monday 2025 online sales on mobile devices, and Omnisend’s 2026 data puts mobile cart abandonment at 79.92 percent against 69.19 percent on desktop. A checkout that degrades under load degrades hardest for the majority of your buyers.
Then re-test with the same scenario and the same targets. A fix is proven when the curve moves, not when the ticket closes. Two or three of these fix-and-prove cycles are normal; that is why they live in September and October.
Weeks 6 to 4: rehearse the peak shape and decide about a queue
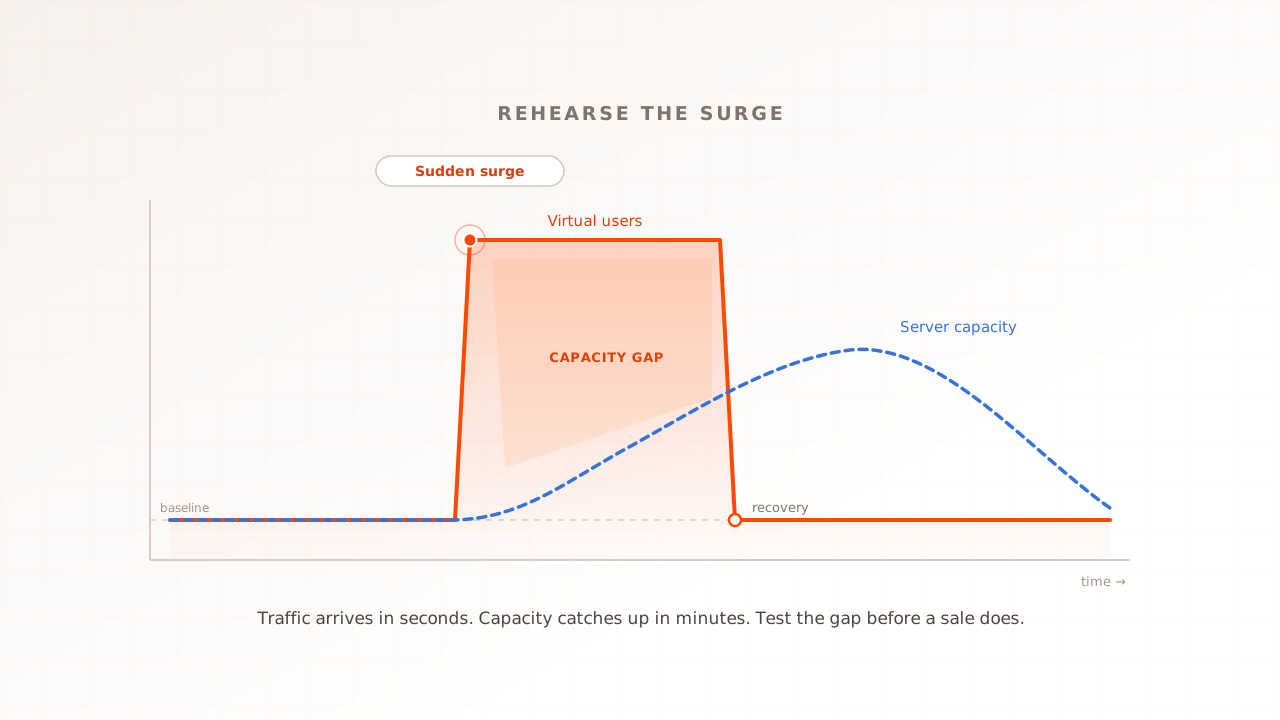
An average-load test proves capacity. Black Friday also opens with a stampede: the email lands, the doors open, and traffic multiplies within minutes. That shape is a spike test, and it deserves its own rehearsal, because systems that hold a steady 1,500 shoppers can still fail when 1,500 arrive in ninety seconds. Autoscaling in particular needs minutes you may not have.
If the spike rehearsal shows demand beyond any capacity you can build in time, decide now about a waiting room, a queue page that admits shoppers at a controlled rate. The honest way to set its admission rate is the ceiling you just measured. A queue set by guesswork either annoys shoppers needlessly or fails to protect the site.
This is also the week the operational side becomes real. Put dashboards on the numbers you tested against, and keep the set small enough to watch: response time on the checkout path, error rate, and orders per minute tell you nearly everything, with server load as the supporting cast. Route the alerts to named people, not just a channel that nobody owns at 7am. Then write a one-page runbook: who watches, who decides, what gets switched off first if the site labours, in what order. Decide the degrade-gracefully moves in daylight, calmly, so nobody designs them at 9am on the day.
Weeks 4 to 2: freeze the code and verify the freeze
A code freeze is a date after which non-essential changes stop. It is not bureaucracy; it is the recognition that every deploy after your last load test ships unproven capacity. The feature merged in mid-November has never met 1,500 concurrent shoppers, whatever its unit tests say.
Freezing two to four weeks out leaves room for an exceptions process, because real fixes will still be needed. The bar for an exception is simple: is this change worth re-testing, and if it is not worth re-testing, is it worth the risk. Then run one final verification test on the frozen build, the same scenario as always, so the last result you hold describes exactly the code that will face the day.
The final week, and the day itself
The final week is standby, not construction. Walk the runbook once with everyone named in it, confirm alerts reach a person and that the person knows they are on watch, and open a channel where the day’s decisions will be made, so nobody hunts for the right thread mid-incident. Pre-scale infrastructure the night before rather than trusting reflexes to be faster than a stampede, warm the caches that can be warmed, and check the site once more at opening time from a real shopper’s position: phone, normal network, full journey.
Then, on the day, watch the three numbers that matter: response time on checkout, error rate, orders per minute. The first symptom of trouble is rarely a crash. It is usually the checkout’s slow tail creeping up while the cached pages stay innocently fast, which is why a homepage check tells you the site is fine right up until the revenue graph says otherwise.
If the numbers drift, act in the order you wrote down: shed the non-essential load first, recommendation widgets, chat, heavy analytics, background jobs, and protect checkout to the end. A slightly slower site that keeps selling is a good day. Most Black Friday disasters are not the first slowdown; they are the improvised response to it. And whatever happens, keep the graphs: the day itself is next year’s sizing data, honest in a way no forecast can be.
How do you know you are ready?
You are ready when every line below is true and you can show the evidence, a report, a date, a name, for each one:
- A load test at target plus headroom, on realistic journeys, passed within the last month.
- The spike shape rehearsed, and the opening minutes survived at sale-open rate.
- The bottleneck list empty, or each remaining item consciously accepted by someone entitled to accept it.
- The freeze active, with the final verification test run on the frozen build itself.
- Dashboards live on the tested numbers, alerts routed to named people.
- A one-page runbook that names people, not roles, and lists what gets shed first.
That list is deliberately short. If one line is false, the week that fixes it is named above, and you know exactly which section to reread. Readiness is not a feeling; it is this list with evidence attached.
Common problems and fixes
Every first-time Black Friday preparation hits at least one of these. The pattern to internalise: most of them are not infrastructure failures but measurement failures, a test that looked reassuring because it quietly measured the wrong thing. Match your symptom, apply the fix, and fold the lesson into next year’s week 12.
| Symptom | Likely cause | Fix |
|---|---|---|
| Test passes easily, day still hurts | Tested the homepage, not the journeys; cache took the load | Re-test browse-to-checkout paths; treat cached and uncached ceilings as different numbers |
| Response times awful from the first minute of the test | Test traffic blocked or rate-limited by WAF or bot protection | Allow the test source before the run; verify with a small smoke test first |
| Checkout collapses while everything else holds | Uncacheable path saturating database or third-party calls | Fix in revenue order: pools, queries, payment and shipping timeouts; then re-test |
| Great steady-state result, opening minutes fail | Spike shape never rehearsed; autoscaling too slow for a stampede | Run a spike-shaped test; pre-scale for the opening; consider a queue with a measured cap |
| November deploy breaks what October proved | No freeze, or exceptions skipped re-testing | Freeze by week 2; every exception earns a verification run |
Twelve weeks compresses honestly: what cannot compress is the order. Targets before testing, testing before fixing, fixing before freezing, and no unproven code into the day. Do that and Black Friday becomes what it should be, your best trading day, observed from a quiet dashboard.
Test in real browsers. Debug in real sessions. Book a demo and we will size a Black Friday rehearsal on your real customer journeys.